

“Absorb what is useful, discard what is not, add what is uniquely your own.”
— Bruce Lee
In a past newsletter we looked at seasonality and whether or not “Sell in May and Go Away” actually works.
The findings were mixed – it definitely reduced drawdowns quite a bit, but in recent years this adage hasn’t really held up in terms of risk-adjusted returns as it negated profitability too much.
But it got me thinking about the reason this adage came to be in the first place.
The reason many investors touted the “sell in may” thing was because markets historically tended to under-perform between May and November for decades, and also experienced some of their worst negative volatility.
Investors wanted to avoid equity turbulence by sitting in cash during these periods to avoid nasty drawdowns, which is obviously natural and the hallmark ambition of a good investor and trader.
But selling during an arbitrary period of the year isn’t really a very robust form of risk management.
It introduces too much “luck factor” in my opinion, as there’s no legitimate objective reason to avoid markets during that time of year other than the fact that they historically did poorly in the past, but with no obvious explanation.
It’s a case of putting the cart before the horse bull, if you will. I think. Maybe that’s the wrong application of that idiom. When in Rome, I guess.
However… what if we did something similar, but instead of selling during historically weak periods of market performance, we used an actual objective method to dynamically determine when markets are “underperforming”.
…something like an indicator condition.
…something as simple as, say, a moving average filter.
Would this work? Let’s find out.
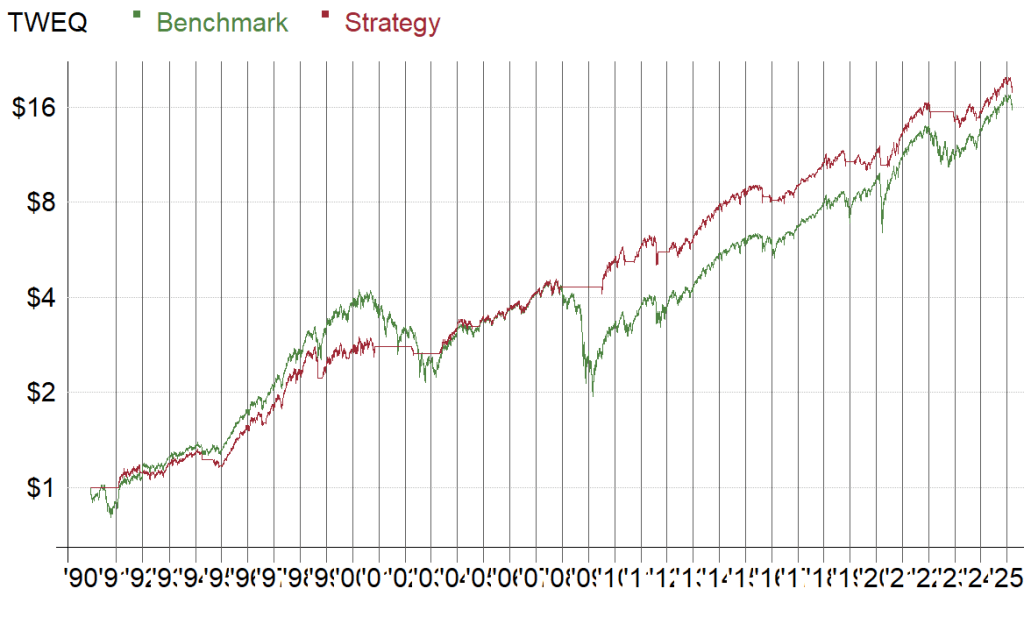
Below I run some tests. All we do is check if the market is trading above its 200-day SMA at the end of each month. If it’s not, sell everything and sit in cash. If it is, sit tight and ride the profit wave.
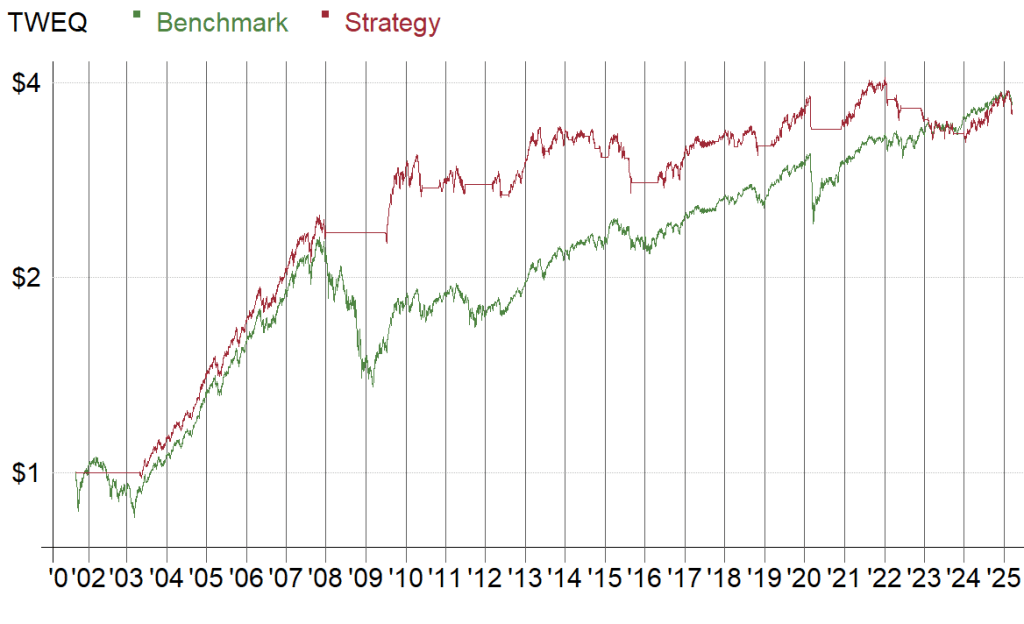
Let’s see if this extremely simple approach can actually beat the benchmarks. Below are the backtest stats from 1990 until today – the benchmark is buy & hold versus the 200 SMA filter.
I used RealTest for this particular test.
For those who believe “you can’t time the market”, or even worse, “you can’t beat the market” – the results might surprise you:
| S&P 500 Benchmark (SPX) ROR: +8.13% Max Drawdown: -56.77% | SPX – 200 SMA Filter ROR: +8.43% (+0.30%) Max Drawdown: -26.08% (-30.69%) |


| NASDAQ-100 Benchmark (NDX) ROR: +13.49% Max Drawdown: -82.90% | NDX – 200 SMA Filter ROR: +14.06% (+0.57%) Max Drawdown: -35.70% (-47.20%) |


| RUSSELL-3000 Benchmark (RUA) ROR: +8.18% Max Drawdown: -57.05% | RUA – 200 SMA Filter ROR: +8.87% (+0.69%) Max Drawdown: -20.55% (-36.50%) |
| S&P/ASX-200 Benchmark (STW.au) ROR: +5.72% Max Drawdown: -41.25% | STW.au – 200 SMA Filter ROR: +6.03% (+0.31%) Max Drawdown: -21.19% (-20.06%) |
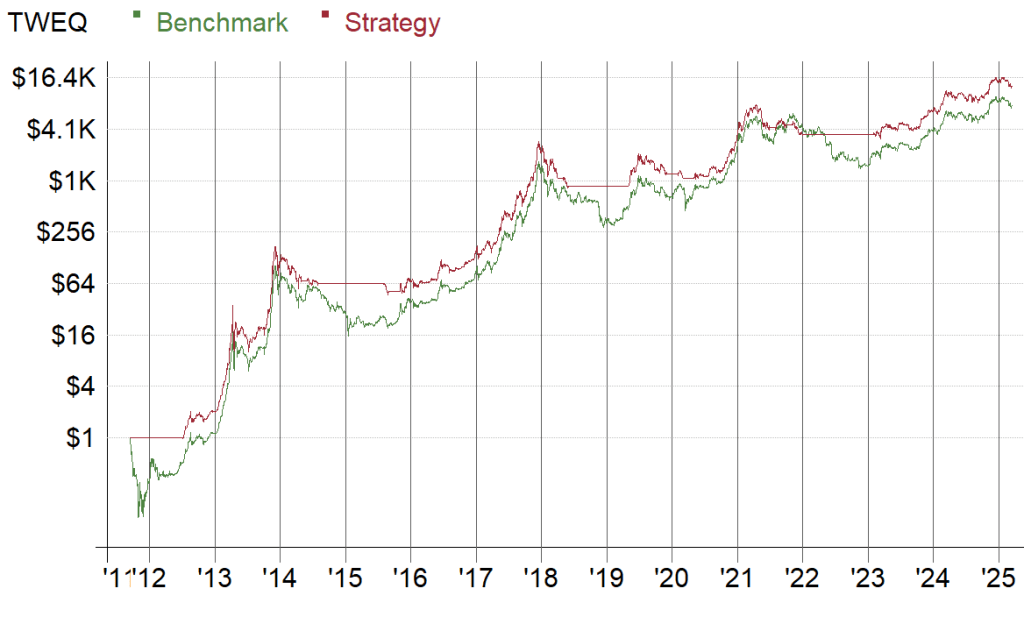
| Bitcoin Benchmark (BTCUSD) ROR: +93.17% Max Drawdown: -88.16% | BTCUSD – 200 SMA Filter ROR: +110.32% (+17.15%) Max Drawdown: -72.71% (-15.45%) |
The moral of the story?
Simple works.
Never underestimate the power and robustness of a simple moving average and other simple indicator filters.
All of these tests blew the benchmark’s stats out of the water on a risk-adjusted basis.
Even Bitcoin – although I don’t think a -72% drawdown is a huge improvement over -88% when it comes to losing your hair (and if you’re leveraged, your house).
But in the very least, it demonstrates why market regime filters are so effective with trend and momentum strategies.
Sure, it’s a small sample, but it’s not cherry-picked – I just chose a few of the most common large cap benchmarks I could think of to test.
I’m sure some markets don’t perform better than the benchmark with this filter applied, especially smaller-cap or high volatility indexes.
But it just goes to show how a simple robust defensive measure applied to a large-cap investment strategy can quite easily beat and time the markets without even adding any extra spice to it, at least versus buy & hold.
Obviously, what makes us traders is the spice we add.
But don’t underestimate simple robust tools, and never indulge unnecessary complexity if it doesn’t add to your bottom line, especially at the cost of robustness.
Just some food for thought.
If you’re interested in learning more about the testing software I used here, subscribe to my channel to see my next YouTube video where I run a backtest on a simple ETF-based investment strategy which rebalances only once per year and yet completely humiliates the benchmark metrics.
You can also get the source code to my personal strategies on my course website if you’re interested.
You can subscribe to and check out my other newsletters here.
Good luck with your trading.
Kind regards,
Matt.

