The 3 Best Forex Trading Indicators

Table of Contents
What Are The Best Forex Trading Indicators?
Every forex trader who depends on technical analysis also depends on technical indicators for their trading process. I have never met a successful forex trader who didn’t use at least one indicator.
So naturally, a common question new traders ask is: what are the best forex trading indicators?
Well, the truth is there is no “best” when it comes to trading. Every trader is different and some traders are better at using certain indicators over others, and some indicators are better suited to certain market conditions over others.
But there are some indicators that I have personally found to be demonstrably effective in developing an edge over the forex markets – which I will explore in this post.
The main problem with choosing which indicators to use is that there are literally thousands of them out there ranging from extremely helpful to downright terrible, and many aren’t even applicable to forex markets.
So how do you know where to start?
In this post I will break down what I believe are the three absolute best forex trading indicators to use in your swing trading and even day trading strategies – and why I personally depend on them in my own trading.
And the best part? They’re all free to download and use on all charting platforms!
1. The ATR Indicator
What Is the Average True Range Indicator?
Number one is an easy choice to make.
It’s the infamous Average True Range indicator. I use this indicator in every single strategy I develop so that I can optimize stop loss and target placement.
The ATR indicator is a technical indicator that calculates the average range of price candles over a given period of time. It was designed by the famous market technician J. Welles Wilder Jr.
Its main purpose is to measure volatility in the markets. By learning to interpret the ATR reading you can learn how to objectively determine market volatility in a practical manner.
This allows you to adapt your strategies across multiple markets and market conditions with relative ease.
There are only a few alternatives for stop loss placement without employing the ATR. A common one is to use a fixed pip amount, which is extremely difficult to adapt and optimize across multiple markets and trading conditions.
Another is to place your stop at whatever price you feel “looks” the best. This is also a very bad idea because then you are going to be inconsistent with your stop placement, which makes it impossible to measure and improve your strategy’s performance over time.
This is the magic of the ATR indicator.
Because the ATR gives you a measure of price volatility in price units (pips), you can use it to calculate your stop loss and targets in an easy, adaptable and objective way that can drastically improve your forex trading results!
As a side note, if you want a more advanced way of applying the ATR indicator, you can try my premium ATR By Time indicator for free:
How To Use the ATR Indicator
One of the biggest problems retail traders typically face when starting out in the forex markets is setting their stop loss orders far too tight.
Using the ATR indicator is a fantastic way to fix this problem by introducing an objective rule into your trading plan based on the ATR reading.
For example, if you are a structure-based trader going long, using a 1 ATR+ stop below the structure swing low can give your trade a much higher chance of success than if it were less than that.
Stop Loss Placement

In the example above the reason to go long would be the bullish engulfing candle right near support.
The ATR value at the time was 0.0006 or 6 pips, and the distance from the close of the engulfing candle to the most recent swing low was 4.2 pips.
By adding these together to get a 10.2 pip stop loss, you would have been safe from the next candle’s wick which tested deeper into the support level and took out anyone with a stop loss less than 1 ATR past the low.
Trailing Stop Loss

In this example (which is an example of my personal forex trading strategy), we have used a trailing stop loss order to lock in profits on an open trade.
Every time the market breaks into a new low (the black lines), we trail our stop loss 1 ATR above the swing high preceding the breakout (the red lines).
This way we allow the market to run in our favor as long as it can while locking in profits, yet giving the trade enough room to breathe during retracements.
Using this method is fantastic for capturing high-momentum and trending markets as you are guaranteed to stay in the trade until the trend reverses (in which case we want to be out anyway).
The catch is you will sometimes give back a lot of open profits, so it is best to combine this approach with a price-action based exit strategy – for example, you may want to come up with a reason to exit when price is near 78.000 instead of allowing it to retrace back 83 pips.
There are pros and cons to all approaches to profit taking so it is up to you to backtest and find a method that you are comfortable with. There is no “best way” to trail your stop loss, but this is one of the best that I know of.
Take Profit Placement

In this example we are using the ATR value to set our take-profit order at a fixed price – 2x ATR below our entry price.
The biggest advantage to this approach is that there is zero discretion involved in exiting the trade. Once you are in, you know where you’re getting out and there is no question of what you should do.
The other advantage is that you are basing your fixed target on the current market volatility. If the market is trending and has momentum behind it then a 2 ATR move is not only possible, but probable.
This type of fixed-target strategy is fantastic for beginner traders. It is easy to backtest and easy to execute. And by only ever taking 2:1 profit you can get away with a lower win rate. The main drawback is that you are capping your upside which is rarely a good idea in forex trading.
Personally I like to use a combination of fixed targets and trailing stop targets. I open two positions per setup with the same stop loss, one with a target 1 ATR from my entry (1:1RR) and the other position with a trailing stop such as in the previous example.
This is a technique I learned from my trading mentor Steven Hart. It works best on strategies with a win rate above 50% as it allows you to capture small wins to cover your small losses while you wait for the bigger wins to come.
You should always do your own testing before you decide on which approach to take. Like I said in the previous example, there are pros and cons to all approaches to profit taking.
It is up to you to balance your methods with your psychology so that you can develop a trading plan that you can execute with confidence and consistency.
What Are the ATR’s Weaknesses?
All indicators have weaknesses.
The ATR indicator’s main weakness is that it is a well-known tool in the trading industry, which means nearly all successful traders use it in some way or another, which means sometimes you are going to get taken advantage of.
Stop loss hunting is a common problem in trading. But it’s not your broker who’s doing it – it’s other traders, and it’s perfectly legal and a perfectly viable trading strategy.
There are going to be certain occasions where using the ATR to set your stop loss will get you taken out right before the market rolls over in your initial direction.
There’s not really any way around this besides being selective with when you trade (ie. not during low-liquidity sessions when large traders can bully price around), and also being creative with how you employ the ATR.
All forex trading strategies will inevitably experience losses, which is where good risk management comes into play – but I can guarantee you that this problem will be much worse if you use less than a 1 ATR stop distance, particularly on intraday timeframes.
Many traders use a single ATR value above swing high/lows, but you can use any multiplier you like depending on your timeframe – 0.5x, 1.5x ATR, 2x ATR, even 3x ATR which might be necessary on some of the lower timeframes like 5-minute charts.
Just make sure to test your strategy over historical data first to make sure that whatever ATR stop you use enhances your edge instead of sabotaging it.
How Does the ATR Formula Work?
I believe it is important that all traders have at least a basic understanding of how their indicators function and what their intended purpose was when they were conceptualized.
The ATR was initially designed for trading futures in commodity markets.
In futures trading the market has a close and an open each day which can result in gaps in price. Therefore J. Welles Wilder Jr. designed the ATR formula to account for that.
The ATR value is determined by the maximum result of the following three calculations:
- Current high minus the current low
- The absolute value of the current high minus the previous close
- The absolute value of the current low minus the previous close
Whichever of these three calculations comes out highest, that is your ATR for the given candle.
Once this value is calculated for historical bars, the current ATR value is typically determined by a 14-period moving average of these values. So the ATR value you see on your indicator screen is an average of the past 14 ATR values.
This means that as markets expand and contract this volatility reading will adapt to the change in candle price ranges.
Pine Script Formula
currentRange = max(abs(high - low), max(abs(high - close[1]), abs(low - close[1])))
But you can use:
atr = atr(Length)
2. The RSI Indicator
What Is the Relative Strength Index?
The RSI indicator cops a lot of flak in the forex trading community from certain forex traders, but I find it to be quite a useful tool if you use it appropriately. Most forex traders don’t.
If you understand the mathematical formula behind the RSI then you’ll understand why it is a useful tool for certain styles of forex trading (and also what its limitations are). It was created by the same guy who made the ATR indicator – J. Welles Wilder Jr.
But first of all, what is the RSI indicator and why was it made?
It is an oscillator indicator which means it can only emit values between a range of 0 and 100. It was originally designed for stock trading to determine price momentum objectively in the quest to identify overbought and oversold conditions.
A high RSI value means that many of the recent candles have been bullish, whereas a low RSI value means that most of the recent candles have been bearish.
Traditionally if the RSI (over a 14-period Daily range) hit a value of 70 then the market was to be considered “overbought” and due for a correction – likewise when the market was “oversold” at 30.
In forex it is used slightly differently. In forex it is a wise idea to forget the notion of “overbought” and “oversold”. Unlike stocks and traditional markets, currencies can and will make moves that defy the laws of market physics – although stocks do that sometimes too.
But whenever there is a dramatic shift in global market fundamentals, cycles or overall conditions, some currencies will enter oversold and overbought territory for lengths of time that will make your eyes water.
So if forex traders can’t use the RSI for determining when markets are due for pullbacks, then what can they use it for?
How To Use the RSI Indicator
The most effective way to use the RSI indicator in forex trading is to spot momentum divergences – particularly on intraday trading timeframes.
This may sound complex if you are new to forex trading but experienced traders know exactly what I am talking about. RSI divergence is a common trading filter for a reason – it works.
It is not a magical indicator that will never lose you trades. In fact, because it is typically used to pick tops and bottoms (which is a style of counter-trend trading), it can be quite difficult for new traders to master.
But once you have experience with strategy development and analyzing price action effectively, the RSI can be used to develop consistently profitable trading strategies with the correct application under the right market conditions.
Perhaps my favorite application of RSI divergence is on double-tops and double-bottoms that occur near major structure.
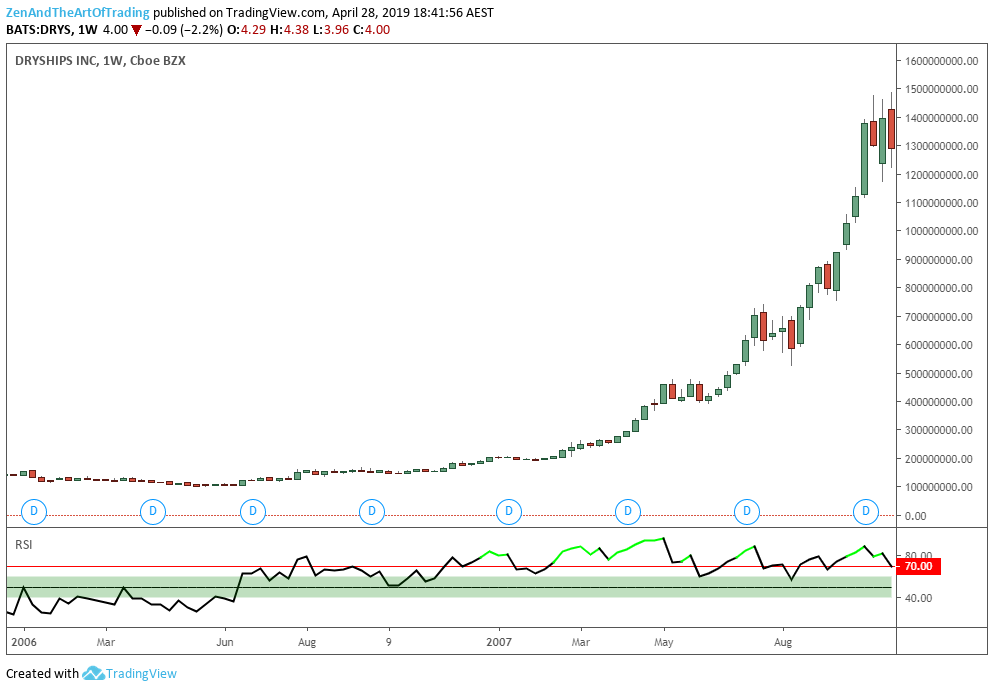
Bearish RSI Divergence

In the above example we have a double-top which occurred near a major higher-timeframe resistance level followed by a bearish engulfing candle (confirming price failure).
We also have divergence on the RSI. Notice that when the first top happened the RSI went above 70 (traditional “overbought” reading). This means nothing to us yet.
But then when we get a second top which fails at the exact same price as the first top, we do not get an equal or higher reading on the RSI indicator.
In fact we get a much lower reading that tells us the momentum leading up to this second top was not nearly as strong as the first top, which is a hint that maybe the buyers are exhausted at this level.
So using a simple price action pattern to confirm our thesis (in this case, a bearish engulfing candle), we go short.
Using the ATR indicator we place a 1 ATR stop above the first top and place our target at the nearest major support level. Winning trade.
Obviously this is a cherry-picked example, but if you go through your historical data and test this strategy with the right rules and conditions you will find an edge with it.
Bullish RSI Divergence

Here is a more traditional example of regular RSI divergence.
In this example price made an impulsive move down and went heavily oversold on the RSI, but then when price rolled over and made another lower-low, the RSI did not make a lower-low or equal low.
This can be a counter-trend setup that signals potential price exhaustion. I would recommend being extra careful with these setups (personally I would only trade these setups near major levels of support).
But it can be a profitable approach to counter-trend trading if used properly and with discretion. I would not recommend this strategy to new traders but experienced traders should definitely experiment with RSI divergence.
Hidden RSI Divergence

The examples above are both occurrences of regular divergence where price makes an equal high or higher high but the RSI makes a lower low (or vice versa for bullish divergence).
There is another lesser-known version of RSI divergence which can also be used to create profitable trading strategies, and that is called hidden divergence.
Hidden divergence is called “hidden” divergence because it’s a rare occurrence and can be difficult to spot.
Bullish hidden divergence is characterized by price making a low, then rallying, then during the retracement price makes a higher low but the RSI prints a lower low.
The opposite is true for bearish hidden divergence. Price makes a high, then falls lower, then during the retracement price makes a lower high but the RSI prints a higher high.
In the case of bullish hidden divergence, this is telling you that the trend is bullish (price is making higher lows) but the longs have panicked and over-sold the crap out of it – creating a potential capitulation buying opportunity for aggressive trend-continuation buyers.
Bearish hidden divergence is telling you that the trend is bearish (price is making lower highs) but buyers have gotten a little exuberant and FOMO has caused a buying frenzy – creating a great shorting opportunity for aggressive trend-continuation sellers.
What Are the RSI’s Weaknesses?
Like all indicators, the RSI has many weaknesses if you don’t apply it properly.
The obvious trading sin is to use it as an overbought and oversold signal. If you use it to sell whenever the RSI reads as “overbought” then you are going to lose money (likewise for going long whenever it’s “oversold”).
The more subtle weakness with RSI divergence is that it is usually a counter-trend or at least a counter-momentum signal. You can find situations where RSI divergence occurs during trend-continuation but it is rare.
More often than not this setup is trading against the underlying medium-term momentum which makes it tricky for some people to trade effectively. That’s why it is necessary to include extra filters such as higher timeframe structure in order to increase its accuracy.
There will be times when RSI divergence will fail and price will enter consolidation or form a flag pattern before heading higher (or lower in the case of bullish divergence setups). As with all strategies, RSI divergence is not a foolproof trading method.
That’s where good risk management comes into play.
But by using the RSI we can objectively define what “weaker” and “stronger” momentum means, which is extremely valuable for creating rules-based price action trading strategies.
How Does the RSI Formula Work?
The RSI formula is designed to give an objective indication of the magnitude of current price momentum.
It is an oscillator indicator which means the value it generates is capped between 0 to 100, with 0 representing extreme bearishness and 100 representing extreme bullishness.
A reading of 0 or 100 is extremely unlikely. It would have to mean that the recent price action has been entirely bearish or bullish with no hint of weakness which is highly unlikely to ever occur.
I have never personally seen an RSI reading hit 0 or 100 but I have seen some markets get pretty close. Bitcoin hit an RSI reading of 93 at the peak of its 2017 bubble if that gives you an indication of how extreme 100 would be.
Calculating the RSI value is a two-step calculation:
RSI = 100 - 100 ÷ (1 + RS)
RS = Average Gain of n bars UP / Average Loss of n bars DOWN
Pine Script Formula
change = change(close)
gain = change >= 0 ? change : 0.0
loss = change < 0 ? (-1 * change) : 0.0
avgGain = rma(gain, 14)
avgLoss = rma(loss, 14)
rs = avgGain / avgLoss
rsi = 100 - (100 / (1 + rs))
rsi = rsi(Source, Length)
3. The Exponential Moving Average
What Is the EMA Indicator?
The Exponential Moving Average indicator is another commonly misunderstood tool among forex traders.
Don’t worry – I’m not going to tell you that moving average crossovers are a good way to trade. But I am going to tell you why I use the EMA as a signature part of my toolkit.
As the name implies, the Exponential Moving Average is another brand of moving average. There are several types of moving averages – simple moving averages, smoothed moving averages, linear weighted, etc….
There are probably dozens more that I’ve never heard of. So which one is the best?
The answer is it doesn’t really matter. They are all lagging indicators, so it is going to be how you use them that matters – not which one you use.
Personally I choose to go with the Exponential Moving Average because I like how it is weighted to give recent price action priority over old price action.
Similar to the ATR indicator, the EMA indicator is a moving average that adapts to market volatility (or at least attempts to). The EMA value is calculated by averaging the closing price of the past X candles (while giving extra weight to the most recent price action).
It admittedly has plenty of weaknesses which I will detail below, but it also has its place on this list for good reason.
How To Use the Exponential Moving Average
There are many ways to use the EMA to create profitable forex trading strategies, but my personal favorite is to combine the EMA as a trend and momentum filter with simple price action and candlestick patterns.
This is a powerful strategy I learned from my mentor Steven Hart. Here is a demonstration of a variation of the strategy that I use:
My personal strategy for intraday swing trading and trend-continuation uses a 50-period EMA and engulfing candles as entry signals. There’s a little more to it than that, but that’s the core of it.
Here are some examples of how you can use the Exponential Moving Average indicator combined with simple candlestick patterns to create a profitable forex trading strategy.
Trend-Continuation Setups

By waiting for price to break below the 50-EMA with an impulsive move and then waiting for an engulfing candle after a pullback (that stays below the EMA), we can exploit high-probability trend-continuation opportunities.
Notice that I also use a 1 ATR stop loss for this setup. That is why the ATR indicator is number one on this list. It is invaluable for strategy creation.
Obviously there must be much more to this strategy than simply shorting engulfing candles below the EMA in order to make it profitable. You will need to backtest variations of rules and conditions yourself to find a profitable approach.
Steven Hart’s EAP course teaches you how to apply all of these indicators profitably with rules-based strategies. If you are interested in learning more you can check out his website by clicking here.
The bullish version of this setup is identical to the bearish version. Wait for an engulfing candle above the EMA and use the ATR to set your stops and targets.
This strategy works with both a trailing stop and a fixed target, although you will need to come up with your own price action rules and conditions for determining when to stand aside.
Trailing Stop Loss

The exponential moving average can also be used as a trailing stop.
You can set your stop loss at the actual EMA value, you can trail it x ATR above/below the EMA value, or you can wait for a candle to close above or below the EMA value.
There are pros and cons to all these approaches. Personally if I were to use this approach I would probably opt for waiting for a candle to close above/below the EMA.
The reason I would do this is because often times the EMA can act as dynamic support & resistance, meaning that price could test through it a few times before reversing direction.
By waiting for a candle to close beyond the EMA you can confirm with better accuracy that it has failed to support price in your favor and therefore it is a good time to exit the trade.
The main drawback with this approach is obvious: you are risking giving up a lot of open profits if you wait until price retakes the EMA. But by getting creative with your rules and adjusting the EMA length, this can be a viable way to protect open profits.
For example this could be a great approach for trend following strategies where you don’t mind giving up a chunk of open profits if it means a higher chance of catching more of the long-term move.
Trend & Bias Filter

Another great way to use the EMA indicator is as a trend filter. If the Daily candle price is above the 200-EMA or below it, then that is typically a good sign that the overall trend is bullish or bearish.
In the above example AUD/JPY has been in a period of chop since the start of 2019. It can be hard for new traders to know which way price is more likely to go from here.
By placing a 200-period exponential moving average over the chart, the picture becomes much clearer.
So long as the Daily price cannot close and hold above the 200 EMA then there’s a higher chance of the long-term trend continuing to the downside than reversing to the upside.
Likewise, if price gets back above the 200 EMA and holds above it for a decent period of time then there is a better chance of it moving higher than lower for as long as that is the case.
This is helpful for new traders to use as a bias filter for their swing trades and intraday trades, and also for rules-based trend-following strategies.
Most traders using this indicator as a trend filter would only be looking for short setups on this pair until price gets back above the 200 EMA.
This can be applied to lower timeframes too. The 200 period moving average can act as a powerful dynamic support and resistance zone and effective directional bias on all timeframes.
Just be mindful of the fact that the longer the period of the moving average, the worse the lag will be behind recent price action. This will benefit your trading sometimes and hurt it at other times, so it is important to be fully aware of how you are using it.
If you are curious about what indicators I am using in these examples then you can find my free TradingView Pullback Indicator here and my Colored EMA here.
What Are the EMA’s Weaknesses?
The biggest weakness by far when it comes to all moving averages is that it’s a lagging indicator.
It is an average of historical bars which means that current price action has very little impact on its value, and a lot can happen in a short period of time which can take it a while to account for.
The Exponential Moving Average attempts to make up for this in part by weighting recent price action with more significance than old price action.
This means it is more reactive to large moves in price and will tend to hug price closer than most other moving averages. This also means it is more susceptible to noise in choppy markets, but choppy markets are not suitable for moving average strategies anyway.
That is why I like to combine it with price action principles and traditional technical analysis. By combining trend, structure and candlestick analysis with an EMA, you can create objective trend-continuation strategy rules with an edge.
The greatest strength of the EMA is that you can use it to objectively define the trend. If price is above it, you might only look for longs. If price is below it, you might only look for shorts.
Sometimes it also acts as a dynamic support or resistance zone and you can use that to your advantage (for example, placing your stop loss or trailing stop some distance behind the EMA – perhaps based on ATR).
But those strengths must be reconciled with the fact that all MAs are lagging indicators and there will be many times when it will give you signals that result in you being caught on the wrong side of reversals or your trailing stops giving back a lot of open profit.
So perhaps the biggest weakness of the EMA is that it requires a fair amount of subjectivity and discretion to know when to use it and when not to use it.
But most indicators share this commonality so I’m not sure it’s a weakness so much as a characteristic of all technical trading indicators.
How Does the EMA Formula Work?
The Exponential or Exponentially Weighted Moving Average is very similar to the Weighted Moving Average formula which also prioritizes recent price data over old data.
The main difference with the EMA is that it gives even more weight to the most recent price data in an exponential fashion instead of a linear fashion like the WMA.
There are three steps to calculate the EMA. Here is the formula for a 5 Period EMA:
1. Calculate the SMA:

(Period Values ÷ Number of Periods)

2. Calculate the Multiplier:

(2 ÷ (Number of Periods + 1) therefore
(2 ÷ (5 + 1) = 33.333%

3. Calculate the EMA:

For the first EMA, we use the SMA(previous day) instead of EMA(previous day):

EMA = {Close - EMA(previous day)} x multiplier + EMA(previous day)
Pine Script Formula
ema = ema(Source, Length)
Conclusion
As with all skills in life – if you know how to apply your tools properly then you can achieve wonders.
But if you misuse them then you will be likely to blame the tools before you consider that you might be applying them incorrectly.
That would be a mistake as I and many other traders have found that all three of these indicators, when used in combination with each other and with basic price action filters, can be exploited to find an edge in the markets.
The ATR indicator is invaluable for adjusting your strategy’s stops and targets to account for expansion and contraction of forex market volatility, which is in constant flux.
The RSI indicator has been known as an overbought and oversold indicator.
But as you can see demonstrated above, with a little bit of creativity and an understanding for how the formula represents price momentum, you can purpose-fit it into an effective setup filter to improve accuracy.
As for moving averages, I don’t think I need to mention the tragic reputation they have as crossover signals. As you can see here, I use them very differently and I find them to be extremely valuable.
For me a moving average is just a way to objectively evaluate momentum. If price is above the EMA then depending on how far away it is from the average, that gives me a gauge of momentum relative to the recent past.
Combining that information with price action strategies is an effective way to develop an edge in the markets.
These are just a few examples of simple indicators and setups that I have found to be effective in the forex markets. There are many, many more that do the job just as well.
But I know these three best and they work for me, so that’s why I chose them.
Do your own testing and research and with a little creativity (and discipline), you never know what you might find.
Always respect that price action is king, but also recognize that the right combination of indicators can serve to enhance your edge in a multitude of invaluable ways.
My Custom Indicators
I have created a bunch of TradingView indicators using Pine Script to aid in my trading process. Here is a list of free tools I’ve made that are relevant to this post: