Dynamic Structure Indicator
This is one of the first indicators I created when I was learning how to code in Pine Script. The purpose of this indicator was to learn how to detect structure using code.
I never managed to get the indicator to be quite as accurate as I would like it to be, and it is still a work in progress. But it can be helpful for new traders to train their eyes to spot these types of zones, and some traders may find the code itself useful for their own purposes.
2021 Update:
I’ve been re-writing this script for the past 3 weeks, and I’ve finally gotten it to a state much closer to what I originally envisioned.
It’s still not perfect and is no substitute for an experienced technical analyst’s eyes (no script ever will be), but it’s the next best thing and the best I can manage with my current level of skill in Pine.
Allow me to finally present the Dynamic Structure Indicator version 2.0!
Table of Contents
How It Works
The script detects major swing highs & lows, then waits for a 1 ATR move in the opposite direction.
If this occurs then the script draws a zone between the wick and body of that high/low until it’s violated by a closing price. Once violated, it then begins looking for a new zone.
If you have Draw Previous Structure turned on then the script will also draw the previous support/resistance zone until that gets violated again (support-turned-resistance etc).
Settings
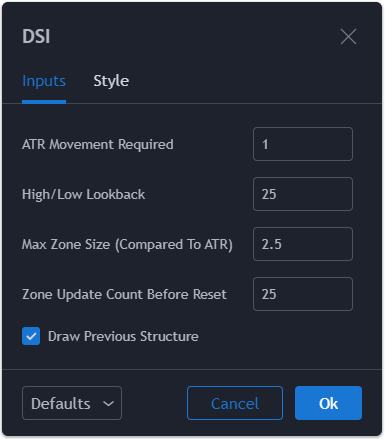
ATR Movement Required:
How many ATRs must price move from a high or low to validate a zone.
High/Low Lookback:
How many bars to look back to identify swing highs and lows in price action.
Max Zone Size (Compared to ATR):
If the zone size exceeds this multiplier of the current ATR then the zone is ignored.
Zone Update Count Before Reset:
This is used to force an update of previous dark S&R zones if they last too long.
Draw Previous Structure:
This turns on/off the darker colored zones which are previous S&R zones.
Alerts
DSI Alert: All of these alerts combined into 1.
DSI Resistance Alert: Price is current testing resistance zone.
DSI Resistance Breakout: Price is currently violating resistance zone.
DSI Support Alert: Price is currently testing support zone.
DSI Support Breakout: Price is currently violating support zone.


Source Code
// This source code is subject to the terms of the Mozilla Public License 2.0 at https://mozilla.org/MPL/2.0/
// © ZenAndTheArtOfTrading / www.pinescriptmastery.com
// Dynamic Structure Indicator v2.0
// Last Updated: 8th January, 2021
// @version=4
study("Dynamic Structure Indicator v2.0", shorttitle="DSI", overlay=true)

// Get user input
atrMovement = input(title="ATR Movement Required", type=input.float, defval=1.0)
lookback = input(title="High/Low Lookback", type=input.integer, defval=25, step=5)
maxZoneSize = input(title="Max Zone Size (Compared to ATR)", type=input.float, defval=2.5, step=0.5)
newStructureReset = input(title="Zone Update Count Before Reset", type=input.integer, defval=25, step=5)
drawPreviousStructure = input(title="Draw Previous Structure", type=input.bool, defval=true)

// Get current ATR value
atr = atr(14)

// Get highest body and lowest body for the current candle
highestBody = open > close ? open : close
lowestBody = open > close ? close : open

// Set up our persistent S&R variables (1 = the wick and 2 = the body)
var res1 = 0.0
var res2 = 0.0
var sup1 = 0.0
var sup2 = 0.0
var lookForNewResistance = true
var lookForNewSupport = true

// Set up our *previous* support & resistance variables (for drawing support-turned-resistance etc)
var previousRes1 = 0.0
var previousRes2 = 0.0
var previousSup1 = 0.0
var previousSup2 = 0.0

// Set up our ATR variables (for identifying significant declines/rallies to validate S&R zones)
var atrSaved = 0.0
var potentialR1 = 0.0
var potentialR2 = 0.0
var potentialS1 = 0.0
var potentialS2 = 0.0

// Detect fractal swing highs for resistance
// We're looking for this pattern: .|.
if high[1] == highest(high, lookback) and high < high[1] and lookForNewResistance
    r1 = high[1]
    r2 = highestBody[2] > highestBody[1] ? highestBody[2] : highestBody > highestBody[1] ? highestBody : highestBody[1]
    if (r1 - r2) / atr <= maxZoneSize
        lookForNewResistance := false
        potentialR1 := r1
        potentialR2 := r2
        atrSaved := atr

// Detect fractal swing lows for support
// We're looking for this pattern: *|*
if low[1] == lowest(low, lookback) and low > low[1] and lookForNewSupport
    s1 = low[1]
    s2 = lowestBody[2] < lowestBody[1] ? lowestBody[2] : lowestBody < lowestBody[1] ? lowestBody : lowestBody[1]
    if (s2 - s1) / atr <= maxZoneSize
        lookForNewSupport := false
        potentialS1 := s1
        potentialS2 := s2
        atrSaved := atr

// Check if potential resistance zone has already been violated. If it has, reset our potential R1 & R2
if close > potentialR1 and barstate.isconfirmed
    potentialR1 := na
    potentialR2 := na

// Check if potential support zone has already been violated. If it has, reset our potential S1 & S2
if close < potentialS1 and barstate.isconfirmed
    potentialS1 := na
    potentialS2 := na

// Check if we've had a significant decline since detecting swing high
if potentialR1 - low >= (atrSaved * atrMovement)
    previousRes1 := na(previousRes1) ? potentialR1 : previousRes1 // Store previous resistance if we're not already drawing it
    previousRes2 := na(previousRes2) ? potentialR2 : previousRes2
    res1 := potentialR1
    res2 := potentialR2
    potentialR1 := na
    potentialR2 := na

// Check if we've had a significant rally since detecting swing low
if high - potentialS1 >= (atrSaved * atrMovement)
    previousSup1 := na(previousSup1) ? potentialS1 : previousSup1 // Store previous support if we're not already drawing it
    previousSup2 := na(previousSup2) ? potentialS2 : previousSup2
    sup1 := potentialS1
    sup2 := potentialS2
    potentialS1 := na
    potentialS2 := na

// Declare support & resistance update counters
// This is used for forcing a zone reset if a zone is not violated within a reasonable period of time
var supCount = 0
var resCount = 0

// If the previous resistance high has been violated then begin searching for a new resistance zone
if close >= res1 and barstate.isconfirmed
    lookForNewResistance := true
    lookForNewSupport := true
    resCount := resCount + 1

// If the previous support low has been violated then begin searching for a new support zone
if close <= sup1 and barstate.isconfirmed
    lookForNewSupport := true
    lookForNewResistance := true
    supCount := supCount + 1

// If our current resistance zone has been violated, store its values to draw new *potential* support zone
// The idea being that once a major resistance zone is violated it often becomes future support
// But we only save previous S&R if we don't already have one saved (or our zone update count exceeds newStructureReset)
if (close > res1 and na(previousRes1) and barstate.isconfirmed) or previousRes1 == 0.0 or supCount >= newStructureReset
    previousRes1 := res1
    previousRes2 := res2
    supCount := 0

// If our current support zone has been violated, store its values to draw new *potential* resistance zone
// The idea being that once a major support zone is violated it often becomes future resistance
// But we only save previous S&R if we don't already have one saved (or our zone update count exceeds newStructureReset)
if (close < sup1 and na(previousSup1) and barstate.isconfirmed) or previousSup1 == 0.0 or resCount >= newStructureReset
    previousSup1 := sup1
    previousSup2 := sup2
    resCount := 0

// If our resistance-turned-support zone has been violated, reset our saved resistance variables
if close < previousRes2 and barstate.isconfirmed
    previousRes1 := na
    previousRes2 := na

// If our support-turned-resistance zone has been violated, reset our saved support variables
if close > previousSup2 and barstate.isconfirmed
    previousSup1 := na
    previousSup2 := na

// Draw our current resistance zone
r1 = plot(res1 == res1[1] ? res1 : na, color=close >= res1 ? color.green : color.red, style=plot.style_linebr, title="R1")
r2 = plot(res1 == res1[1] ? res2 : na, color=close >= res1 ? color.green : color.red, style=plot.style_linebr, title="R2")
fill(r1, r2, color=close > res1 ? color.green : color.red, transp=50, title="Resistance Zone")

// Draw our current support zone
s1 = plot(sup1 == sup1[1] ? sup1 : na, color=close < sup1 ? color.red : color.green, style=plot.style_linebr, title="S1")
s2 = plot(sup1 == sup1[1] ? sup2 : na, color=close < sup1 ? color.red : color.green, style=plot.style_linebr, title="S2")
fill(s1, s2, color=close < sup1 ? color.red : color.green, transp=50, title="Support Zone")

// Draw our previous support zone (turned potential resistance)
ps1 = plot(previousSup1 == previousSup1[1] and previousSup1 != sup1 and drawPreviousStructure ? previousSup1 : na, color=color.red, style=plot.style_linebr, title="PS1")
ps2 = plot(previousSup1 == previousSup1[1] and previousSup1 != sup1 and drawPreviousStructure ? previousSup2 : na, color=color.red, style=plot.style_linebr, title="PS2")
fill(ps1, ps2, color=color.red, transp=10, title="Previous Support Zone")

// Draw our previous resistance zone (turned potential support)
pr1 = plot(previousRes1 == previousRes1[1] and previousRes1 != res1 and drawPreviousStructure ? previousRes1 : na, color=color.green, style=plot.style_linebr, title="PR1")
pr2 = plot(previousRes1 == previousRes1[1] and previousRes1 != res1 and drawPreviousStructure ? previousRes2 : na, color=color.green, style=plot.style_linebr, title="PR2")
fill(pr1, pr2, color=color.green, transp=10, title="Previous Resistance Zone")

// Check alert conditions
alertResistance = high >= res2
alertSupport = low <= sup2
alertResistanceBO = close >= res1
alertSupportBO = close <= sup1

// Trigger alerts
alertcondition(alertResistance or alertSupport or alertResistanceBO or alertSupportBO, title="[DSI] Alert!", message="DSI alert for {{ticker}}")
alertcondition(alertResistance, title="[DSI] Resistance Alert", message="Price has entered current potential resistance zone for {{ticker}}")
alertcondition(alertSupport, title="[DSI] Support Alert", message="Price has entered current potential support zone for {{ticker}}")
alertcondition(alertResistanceBO, title="[DSI] Resistance Breakout", message="Price has broken past potential resistance zone for {{ticker}}")
alertcondition(alertSupportBO, title="[DSI] Support Breakout", message="Price has broken past potential support zone for {{ticker}}")
Last Updated: 8th January, 2021


Thank you for your work, I can see the days of labour put into this script and it enhancing trading decisions. I will find time to backtest it with my trading strategy.
Thank you.