HTF High / Low Indicator
This simple script draws higher-timeframe price data to your chart. You can set which timeframe to draw, and the script will render the high/low for that timeframe.
You can also set it to color the zones between the higher-timeframe closes and highs/lows.
How It Works
You set the HTF resolution to scan, the lookback period to use and then the script draws the relevant information to your chart.
The upper line is the high of the previous higher-timeframe candle, and the lower line is the low of the previous higher-timeframe candle.
Settings
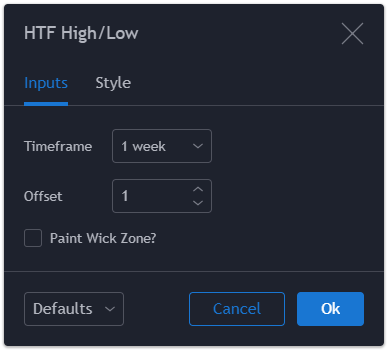
Timeframe:
This sets the timeframe resolution to analyze.
Offset:
(This option was removed on 29th April, 2020 due to being unnecessary).
Paint Wick Zone?
If enabled then this setting will make the script paint the zone between the highest candle close and the highest high and the lowest candle low and lowest close for the given timeframe.


Source Code
// Created by Matthew J. Slabosz
// www.zenandtheartoftrading.com
// Last Updated: 9th October, 2020
// @version=4
study("HTF High/Low", overlay=true)

// Get input
res = input(title="Timeframe", type=input.resolution, defval="D")
paint = input(title="Paint Wick Zone?", type=input.bool, defval=false)

// Create non-repainting security function
rp_security(_symbol, _res, _src) => security(_symbol, _res, _src[barstate.isrealtime ? 1 : 0])

// Get HTF price data
htfHigh = rp_security(syminfo.tickerid, res, high)
htfLow = rp_security(syminfo.tickerid, res, low)
htfOpen = rp_security(syminfo.tickerid, res, open)
htfClose = rp_security(syminfo.tickerid, res, close)

// Plot data to chart
r1 = plot(htfHigh, color=color.red, title="HTF High")
s1 = plot(htfLow, color=color.blue, title="HTF Low")

// Fill wick zone
r2 = plot(paint ? htfOpen > htfClose ? htfOpen : htfClose : na, color=na, transp=100)
s2 = plot(paint ? htfOpen < htfClose ? htfOpen : htfClose : na, color=na, transp=100)
fill(r1, r2, color=color.red, transp=50, title="HTF High Zone")
fill(s1, s2, color=color.blue, transp=50, title="HTF Low Zone")

// Trigger alerts
longAlert = close > htfHigh
shortAlert = close < htfLow
alertcondition(longAlert or shortAlert, title="HTF Breakout Alert", message="Breakout alert for {{ticker}}")
Last Updated: 9th October, 2020


You’re doing an awesome job making all these indicators. Just wanted to say thanks!!
Thanks heaps! I appreciate the kind words :)
Would it be possible to invalidate (delete) previous highs and lows if future highs and lows pass the previous levels?
I’m attempting to plot close levels, and once those levels are invalidated (price crosses and closes beyond the previous level), they will be deleted.
I’m only struggling with the logic for level invalidation, any assistance from a seasoned dev would be greatly appreciated!
Cheers for all you do
Hey Mitch! Yes technically this is possible but it would require a bit more advanced coding, I don’t have time to code it myself but I suggest looking into line objects – you cannot retroactively remove plots from the chart, but you can remove line objects. So displaying the high/lows as lines and keeping track of them in an array is how I’d suggest going about it – https://www.tradingview.com/pine-script-docs/concepts/lines-and-boxes/?aff_id=15271#creating-lines
Thank you for your prompt response! Legend! Yes, as you responded, I was updating my question with my current logic idea, which includes using arrays, line objects and < / > if statements. The fact that what I’m trying to accomplish has been deemed possible is enough for me to continue learning and applying! As I understand and appreciate your time, I will look rigorously into your suggestions before inquiring again. If I am stuck again next week, I may ask whether I’m on the right track with my logic. Thank you once again. I’m sure I’ll see you in… Read more »