Trading Probabilities: The Gambler’s Fallacy
I recently received a very interesting question from a student enrolled in my Pine Script Mastery Course that I want to share my reflections on:
I wanted to share my idea for a risk management strategy. If a strategy with a 50% win rate has a consecutive number of winning trades, it is more likely to have a losing trade approach shortly afterwards. And the same thing with a losing streak. If there are more losses in a row, then there is a higher probability of a winning trade coming along.
So I want to introduce a dynamic risk management strategy. A risk management concept that reduces the risk after a win streak and increases the risk after a losing streak. This can take a 50% Win/Loss strategy and increase the net profit.
Can you please provide some guidance. I am confident that if solved, this dynamic risk management strategy can improve your strategy scripts too.
A Pine Script Mastery Student
As I said in my reply to this ambitious student – the idea is very interesting, but it is actually a dangerously misguided interpretation of probability theory, which I’ll explain shortly.
But first I want to mention that I have a somewhat similar dynamic risk management strategy I’ve experimented with which is designed to reduce my risk during losing periods.
But, instead of considering the probabilities of the next trade losing or trying to guess when the next trade will win, I simply reduce my risk based on the extent of my current drawdown.
This is an old approach that was invented decades ago by the infamous Turtle traders. Here’s an article on this subject written by Nick Radge which you might find extremely valuable to read (I sure did):
In a future blog post/email I will explore some reasonable and interesting ideas I’ve encountered for adjusting position sizing and risk to optimize and enhance a system’s edge and risk-adjusted returns. (Click here to sign up to my mailing list to receive future free content and updates!)
But as for increasing or reducing risk based on the probability of the next trade winning or losing, while it sounds good in theory, this is actually a well-documented trap that many people tend to fall into in the early stages of their trading journey (myself included).
The reality is that each trade’s outcome has no real correlation to the previous trade. The fact that a streak of losing or winning trades occurred recently has zero effect on the outcome of the next trade.
The technical term for this trap is “Gambler’s fallacy”, because it’s popular for gamblers to think that a “cold streak” is more likely to be broken when in fact there is absolutely no change in the probabilities.
Here’s an excerpt from Wikipedia on the subject:
The gambler’s fallacy, also known as the Monte Carlo fallacy or the fallacy of the maturity of chances, is the incorrect belief that, if a particular event occurs more frequently than normal during the past, it is less likely to happen in the future (or vice versa) …
… The fallacy is commonly associated with gambling, where it may be believed, for example, that the next dice roll is more than usually likely to be six because there have recently been fewer than the expected number of sixes.
Wikipedia: Gambler’s fallacy
And another excerpt from later in the article:
Perhaps the most famous example of the gambler’s fallacy occurred in a game of roulette at the Monte Carlo Casino on August 18, 1913, when the ball fell in black 26 times in a row.
This was an extremely uncommon occurrence: the probability of a sequence of either red or black occurring 26 times in a row is (18/37)26-1 or around 1 in 66.6 million, assuming the mechanism is unbiased.
Gamblers lost millions of francs betting against black, reasoning incorrectly that the streak was causing an imbalance in the randomness of the wheel, and that it had to be followed by a long streak of red.
Wikipedia: Gambler’s fallacy
While in trading things are a little more complicated than the spin of a roulette wheel, and probabilities in financial markets are not as uniform as casino games, the principle still applies to trading where we truly have no idea what the likelihood of the next trade winning will be, especially when trading systematic strategies or systems based on patterns and probabilities.
It’s also worth mentioning that depending on the roulette table, the chance of landing on black or red is not 50/50 because as we all know, just like professional traders, the casino only plays games that it has the edge in.
The odds of hitting red or black in American roulette are 47.4%. This rises slightly in European roulette, to 48.6% – based on whether the table has one green zero or two green zeros on the wheel which do not pay out for neither black nor red.

Recently I went to the casino for a bit of fun with my girlfriend while we were visiting Melbourne city (something I rarely do given my understanding of the casino’s edge), and we played some roulette. I put $100 on black and it came up, lucky me! But because I was playing it on a digital screen and I forgot to take my winning chip off black, I accidentally left it there for 5 more spins – all of which won.
I turned $100 into $600 through pure dumb luck (literally – I didn’t mean to leave the chip there, which was pretty dumb). Luckily I noticed the chip before the 6th spin, which turned up red. While chatting to my girlfriend and placing small bets on individual numbers, I somehow failed to notice my winnings going up by $100 each spin.
This is the second time I’ve won big on roulette by mistake – the first time was many years ago when showing my girlfriend how to play, when I accidentally bet $20 on a single number instead of $2, and the number came up – a 1 in 37 chance. Which just goes to show how utterly random luck can be in casino games (or maybe the secret to my luck is to bring my girlfriend along?)
In any case, this article is not about roulette or casino games – and all of this is not to say that there aren’t creative risk management and position sizing techniques and models out there that we can apply to our trading which are effective at improving a system’s profitability or risk-adjusted returns.
There are several techniques out there that, when used properly and appropriately for a particular system, can enhance the results – such as employing filters to increase the winning probability of our systems, or using a position sizing model similar to the Kelly formula to find the most efficient ‘bet size’ for our system’s typical win rate (I’ll elaborate on these ideas in the next email/blog post as this subject is its own can of worms altogether).
But my point today is to inform you (or remind you if you already knew) that when dealing with winning streaks or losing streaks in our trading, it is dangerous to assume you know the likely outcome of the next trade just because you’ve had a string of “good” or “bad” luck.
While I don’t claim to be an expert on probability theory, I have learned a lot about how it applies to trading in recent years, especially from Nick Radge – a highly reputable veteran Australian trader who has designed and successfully traded systematic stock strategies in the global markets for over 35 years and knows a thing or two about developing an edge over the financial markets.
Here are a few key takeaways from what I have learned about this subject so far:
- The sequences of winning and losing trades is completely random over short time windows and can remain lopsided one way or another for a much longer duration than you might think is possible.
- The easiest way to demonstrate this phenomenon is by flipping a coin. A coin flip has a 50/50 chance of heads or tails, and this 50% probability is true for every single flip – so we can observe these winning/losing streaks over short sample sizes.
- I coded a program that simulated a random 50/50 flip of a “coin” over a given number of flips (landing on either one or zero to emulate heads or tails). When I input a huge sample size like 100,000+ flips, the overall probability is almost always exactly 50% or extremely close. But on shorter sample sizes of 100 or less, it can often become skewed by up to 10% or more – resulting in a 40% or 60% win rate in some cases.
- This is why a large sample size of trades is required during backtesting, preferably 500+, in order to accurately estimate the efficacy and robustness of a trading system. Anything less than 500 trades is prone to demonstrate a much higher degree of randomness in outcomes. I usually try to get 1000+ trades included in my test sample data – but this can be difficult to achieve depending on the system and timeframe.
- These winning & losing streaks occur because there is absolutely no correlation between flips. Regardless of what side the coin landed on previously, the next flip still has a 50% chance of landing on either side again – just like the roulette table in the Monte Carlo Casino back in 1913 when the ball landed on black 26 times in a row.
- Because of the randomness in outcomes of a coin flip (or a brief sequence of trades), there will be streaks of either outcome that occur no matter how high your win rate is. It’s possible to estimate the potential length of a winning or losing streak using a mathematical formula:
LS = Ln(N) ÷ Ln(1-Win%)
Where:
LS = Losing Streak
Ln = Natural Logarithm
N = Number of Trades
Win% = Strategy Win Rate
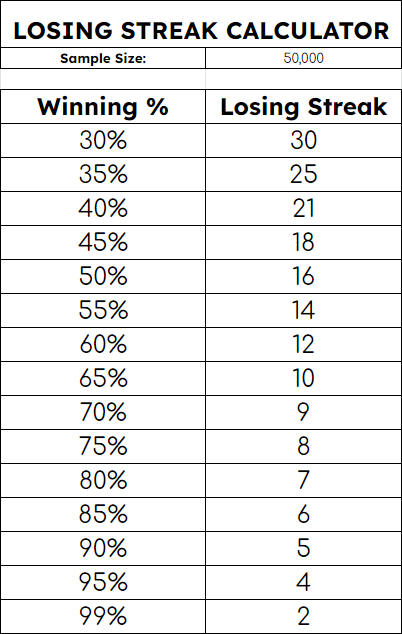
It’s important to run this formula over a large sample size, ie. Set the N (number of trades) to something like 50,000 flips.
When we run these numbers through the above formula with a 50% win rate like in the coin toss example, the number we get is 16.
LS50 = Ln(50000) ÷ Ln(0.5) = 15.6
Which means that with a 50% win rate it is statistically likely that, at some point over a large enough sample of trades, it is possible you will encounter 16 losing trades in a row.
Running the same formula on a 30% win rate obviously gives a much higher losing streak:
LS30 = Ln(50000) ÷ Ln(0.7) = 30.34
Probability Table:
How do we use this information as traders?
Well, if you’re risking 2% per trade on a strategy with a 50% win rate, have you thought about how comfortable you would be when you inevitably encounter a 27%+ drawdown in your capital?
I get the 27% number because subtracting 2% of your capital for each losing trade means your position size will actually shrink over that streak of losing trades as your account balance shrinks, so the real drawdown would not necessarily be 16 x 2%, but rather -2% added up over 16 trades.
Anyway, the point is this: as traders we are playing the long-game. And I don’t mean going long vs going short – I mean we are in this game for the long-term, for the next thousand trades.
The next ten, twenty or even 100 trades are largely irrelevant to our career as traders so long as we are managing our risk appropriately and we don’t go bust financially or psychologically over that shorter term period which is just a snapshot of our (hopefully) decades-long venture as traders.
Understanding probability theory in relation to trading can help us stay the course and avoid catastrophic drawdowns or implosions.
Not only can we use this approach to understanding our system’s strengths and weaknesses to prevent ourselves taking on too much risk and either blowing up or dealing ourselves a severe psychological blow due to encountering an uncomfortably nasty drawdown…
But we can also use this information to develop optimal position sizing models to enhance our risk-adjusted returns in some cases (such as employing a variation of the Kelly formula to better size your average “bet” size on each trade based on the probability of them winning over a large sample size – which is something I’ll cover in a future blog post/email as this one is long enough already).
What do you think? Please leave a comment below with any thoughts you have about this concept, or any ideas you have for managing your risk efficiently and dynamically while avoiding the trap of trying to predict the future. I read and appreciate each and every comment!
I hope you found this information interesting and that it inspires some valuable ideas. Good luck with your trading, and I’ll speak with you in the next email/blog post :)
Best regards,
Matthew.


Nice blog Matthew, thanks for reminding me of the mathematics of probabilities. As Traders we are so accustomed to the importance of numeric performance, so it never fails to amaze me how the psychology of trading clouds better judgement so often.
The inverse of the losing streak, the winning streak, I find the biggest bear trap of all……leading us to the feeling of invincibility on every subsequienet trade and perhaps taking bigger and more perilous risks.
I sent you a DM about dynamic risk strategy based on the 33% win betting martingale strategy this is a better system rather than 50/50 as risk of ruin is to high. If you use this on a strategy that wins wins 40% of the time and pays out 2 to 1 then with even distribution you will print money check out your DM from pipfiend.
Great post. Totally get the gamblers fallacy thing. Never heard about the streak formula before, super interesting. Will research that. Thanks for the info, appreciated. Love reading these blog posts.
Ive been coding now for about 3 months and I am loving it. Keep up the great work, Thanks
Thanks Matthew for sharing, great read, I would like to learn more from your perspective on the Kelly Formula. I have built a bot and a working algorithm for trading crypto, which works very well. However has some issues which I now have some really good ideas to reduce the risk. Hence me exploring pine and your course. The biggest issues I had was the FOMO/Psychological, so I had to rely more on statistics to help me manage risk, especially when Crypto Markets do not sleep i would wake up every hour and check my phone.. I now have some… Read more »
50p coin has no idea what the outcome of the previous flip was, and it doesn’t care! The chance on the next flip is 50/50 all over again. Same with trading, the market doesn’t know what you’ve won or lost and it doesn’t care either! Consistency, rules and discipline… and edge, that’s what might tip the balance in your favour. Not “i’ve lost so many in a row now, it must be my turn to win” – nope!
Hi Matthew, I inmediately saw the mistake in the student’s question, so I was pleased to read your explanation of the gambler’s falacy. However, couldn’t it be that, depending on the strategy, the probabilities of winning of consecutive trades are not completely independent? For instance, consider a mean reverting strategy. If the market is in a prolonged and steep trend, we may see several consecutive losses. Depending on the market and the rules of the strategy, it may actually be the case that a losing trade does give us some information about the state of the market and, thus, modifies… Read more »
Hey Juan, thanks for the thoughtful reply. You’re certainly right that there’s more nuance to the gambler’s fallacy in the context of trading than in casinos. I think for beginner traders in particular, understanding the trap of gambler’s fallacy is important. But if you’re an experienced trader, and you know how to manage risk appropriately, there’s no harm in exploring ideas like the one you mentioned regarding mean reversion. The further a market moves from its average especially in a short time period, the more it’s theoretically limited in how far it can continue to move away from its average… Read more »