Moving Average Zones Indicator
This is an experimental indicator I made for trend-continuation strategy development.
I have not begun testing on this indicator yet but the moving average zones can be used as zones of value for entering in the direction of a strong trend.
How It Works
The green zone is the price between the 50 EMA and the 50 SMA.
The orange zone is the price between the 100 EMA and the 100 SMA.
The red zone is the price between the 200 EMA and the 200 SMA.
Settings
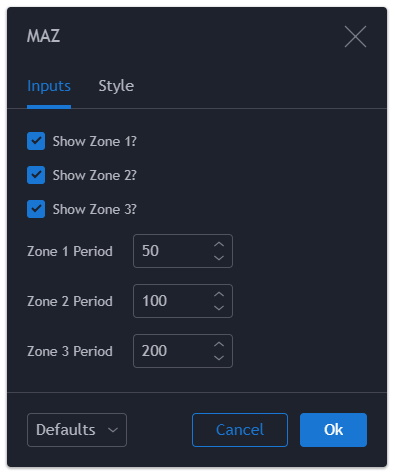
Show Zone 1?
If disabled then the zone between the 50EMA and the 50SMA will not be drawn.
Show Zone 2?
If disabled then the zone between the 100EMA and the 100SMA will not be drawn.
Show Zone 3?
If disabled then the zone between the 200EMA and the 200SMA will not be drawn.
Zone 1 Period:
This sets the first zone’s moving average period.
Zone 2 Period:
This sets the second zone’s moving average period.
Zone 3 Period:
This sets the third zone’s moving average period.


Source Code
// Created by Matthew J. Slabosz
// www.zenandtheartoftrading.com
// Last Updated: 28th September, 2020
// @version=4
study(title="MA Zones", shorttitle="MAZ", overlay=true)

// Get user input
showZone1 = input(title="Show Zone 1?", defval=true)
showZone2 = input(title="Show Zone 2?", defval=true)
showZone3 = input(title="Show Zone 3?", defval=true)
zone1 = input(title="Zone 1 Period", defval=50, minval=1)
zone2 = input(title="Zone 2 Period", defval=100, minval=1)
zone3 = input(title="Zone 3 Period", defval=200, minval=1)

// Get indicator values
ema1 = ema(close, zone1)
ema2 = ema(close, zone2)
ema3 = ema(close, zone3)
ma1 = sma(close, zone1)
ma2 = sma(close, zone2)
ma3 = sma(close, zone3)

// Plot MAs
plot(showZone1 ? ema1 : na, color=color.lime, transp=50)
plot(showZone1 ? ma1 : na, color=color.lime, transp=50)
plot(showZone2 ? ema2 : na, color=color.orange, transp=50)
plot(showZone2 ? ma2 : na, color=color.orange, transp=50)
plot(showZone3 ? ema3 : na, color=color.red, transp=50)
plot(showZone3 ? ma3 : na, color=color.red, transp=50)

// Draw invisible plot lines required for zone color fill
z1 = plot(showZone1 ? ema1 : na, title="EMA 1", color=color.black, transp=100)
z2 = plot(showZone1 ? ma1 : na, title="MA 1", color=color.black, transp=100)
z3 = plot(showZone2 ? ema2 : na, title="EMA 2", color=color.black, transp=100)
z4 = plot(showZone2 ? ma2 : na, title="MA 2", color=color.black, transp=100)
z5 = plot(showZone3 ? ema3 : na, title="EMA 3", color=color.black, transp=100)
z6 = plot(showZone3 ? ma3 : na, title="MA 3", color=color.black, transp=100)

// Fill zones
fill(z1, z2, title="Zone of Value 1", color=color.lime, transp=75)
fill(z3, z4, title="Zone of Value 2", color=color.orange, transp=75)
fill(z5, z6, title="Zone of Value 3", color=color.red, transp=75)
Last Updated: 28th September, 2020

