Free TradingView Scripts
Table of Contents
ATR+ (Stop Loss Indicator)

ATR Trailing Stop Loss Indicator
Aggressive Pullback Indicator

RSI Swing Signal Indicator

Volume+ (RVOL by Time) Indicator

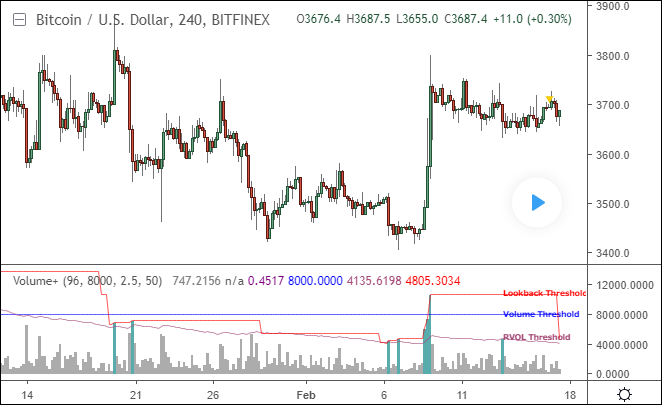
Volume+ (RVOL / Alerts) Indicator
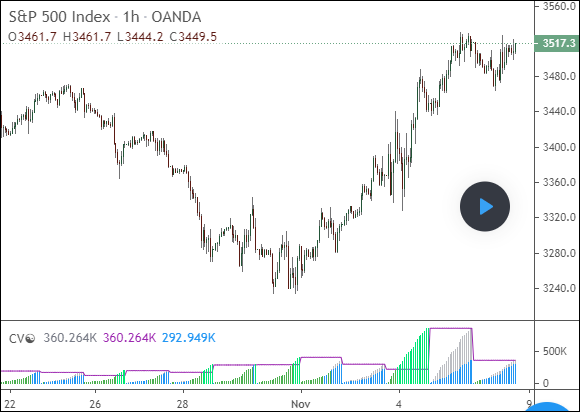
Cumulative Volume Indicator
Correlation Meter Indicator

Breakout Indicator

FTB Strategy (PineConnector)

Hammers & Stars Strategy
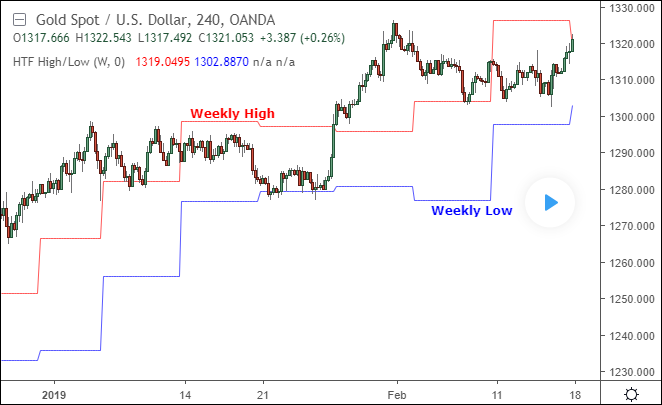
HTF High / Low Indicator
HTF EMA Indicator

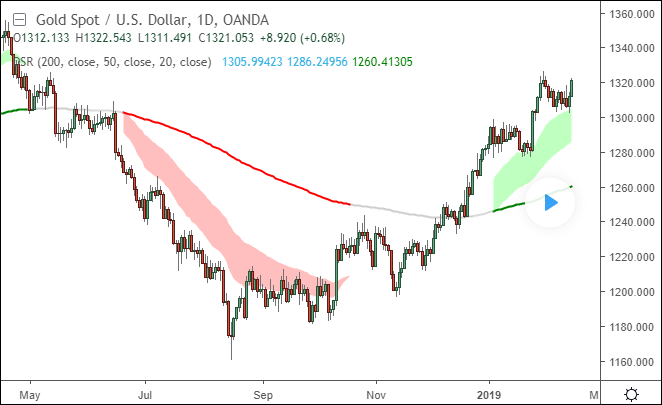
Trend Strength Indicator

RSI Overbought/Oversold Indicator

S&R Zone Signals Indicator

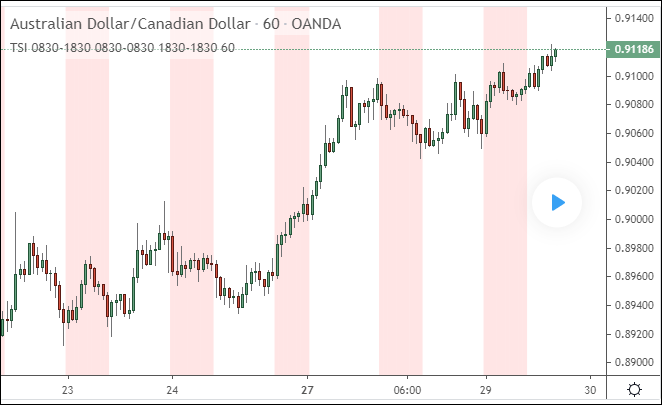
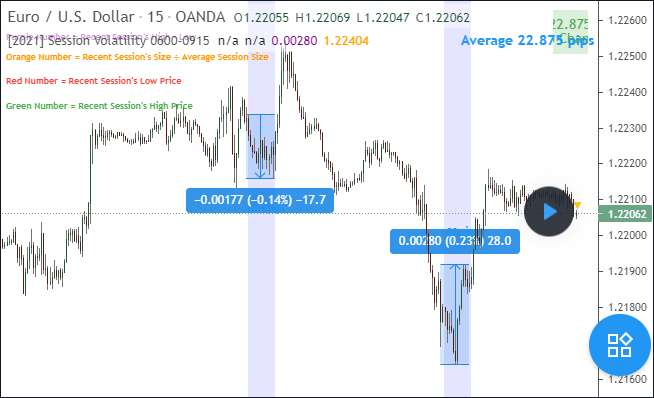
Session Volatility Indicator
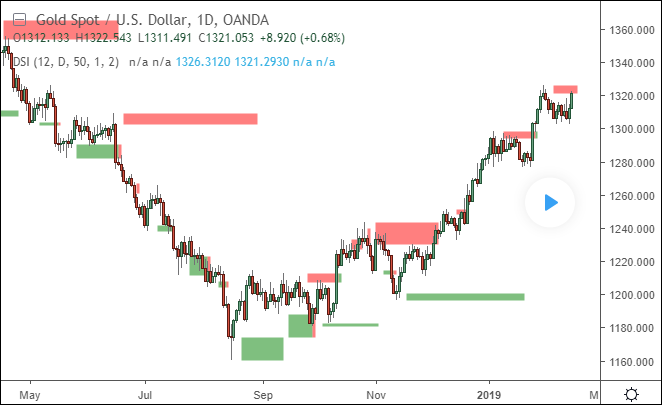
Dynamic Support & Resistance Indicator
Dynamic Structure Indicator
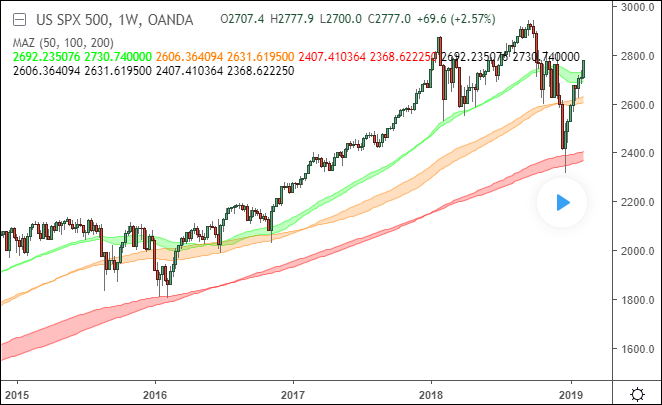
MA Zones Indicator
Colored EMA Indicator

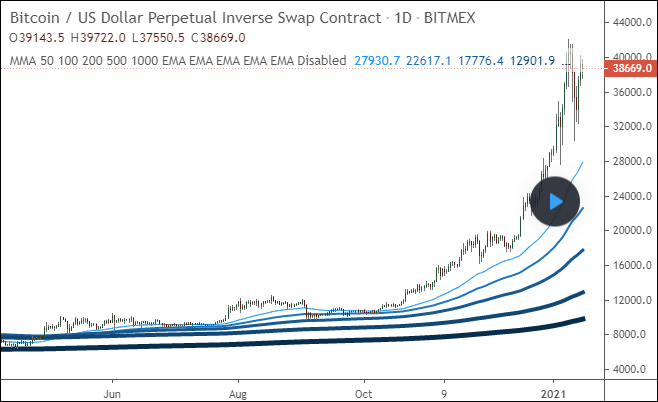
Multiple Moving Averages
Trading Session Indicator