Volume+ (RVOL by Time) Indicator
This indicator is similar to my original RVOL Indicator, but this one calculates relative volume based on the candlestick’s time of day rather than a moving average.
Table of Contents
How It Works
This script is an enhanced volume indicator.
It calculates relative volume (RVOL) based on the average volume by time of day (rather than a simple moving average).
For example, using this indicator you can see today’s volume during the first 5-minute candle of the market open compared to the previous day’s volume at the market open.
Or you can see today’s volume at the market close during the last 15-minute candle compared to the average of the past 20 days of volume at the market close.
Due to the different quantity of candlesticks in a session between Stocks and Forex/Crypto, I separated those markets into separate settings, making this an all-in-one RVOL indicator that works on all markets.
For more information see the TradingView page.
Settings
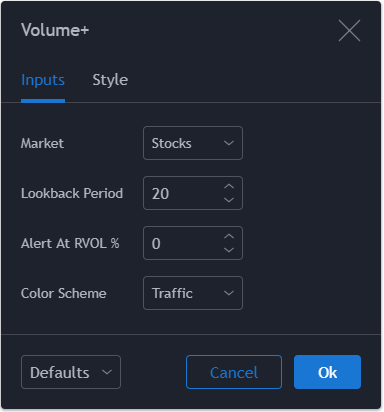
Market:
Choose from Stocks, Futures, Forex and Crypto. Stocks [<5m] is for traders wanting to use this indicator on Stocks below the 5-minute timeframe (ie. 1-minute and 3-minute charts).
Lookback Period:
How many sessions to calculate for. For example, a 20 period lookback on the 5-minute chart will show you the average volume for the past 20 days of price action for each 5-minute candle.
A 1 period lookback will show you yesterday’s volume relative to today’s.
Alert At RVOL %:
If you leave this at zero it has no effect. If you change it, then whenever a volume bar exceeds this % of the average, you will get an alert. You have to set up the alerts first through the TradingView interface before this will trigger.
If you leave this at zero and set a TradingView alert, then an alert will be triggered whenever volume exceeds the average. Changing the color scheme to Trigger will show you which volume bars trigger alerts.
Color Scheme:
There are four different color settings:
Heatmap – Changes color to be brighter based on higher RVOL
Price – Changes color based on price action
Traffic – Changes color based on RVOL percentages (for fast visual cues)
Trigger – Changes color only when the specified alert conditions are met
Heatmap:
Turns very bright green at 2.0 RVOL
Turns light green at 1.0 RVOL
Turns normal green at 0.75 RVOL
Turns medium green at 0.5 RVOL
Turns very dark green at 0.25 RVOL
Is gray otherwise.
Price:
Turns red if the price action candle closed bearish.
Turns green if the price action candle closed bullish.
Traffic:
Turns red if RVOL is between 1.0 and 1.5.
Turns orange if RVOL is between 1.5 and 2.0.
Turns dark green if RVOL is between 2.0 and 3.0.
Turns bright green if RVOL is above 3.0.
Is gray otherwise.
Trigger:
Turns teal if any of the given alert conditions in the user settings are met.
How To Set Alerts
If you have any trouble setting alerts, try reading this article where I explain in detail how TradingView’s alert system works.


Source Code
The source code for this particular script is private.
If you’d like to purchase access to all of my source code including detailed video lessons explaining how and why it was written, then you can find more information over at www.pinescriptmastery.com.
And if not that’s fine! No hard feelings. Not everyone is willing to invest in their education and I respect that decision. But feel free to help yourself to my wealth of other open-source scripts.
Last Updated: 24th April, 2020


this indicator is AMAZING. thank you so much