Dynamic Support & Resistance Indicator
This Pine Script indicator is designed to visually identify zones of value (ie. dynamic support and resistance).
The zones are determined by three exponential moving averages operating in confluence. It is useful for trend-continuation and trend-following price action strategies.
How It Works
The default settings are:
Long-term EMA: 200 Period.
Short-term EMA 1: 50 Period.
Short-term EMA 2: 20 Period.
So according to the default settings, when the 20EMA is above the 50EMA, and the 50EMA is above the 200EMA, the area between the 20EMA and the 50EMA will turn green.
When the 20EMA is below the 50EMA, and the 50EMA is below the 200EMA, the area will turn red. When the EMAs are all over the place (ie. price is consolidating), the area will be painted white.
Settings
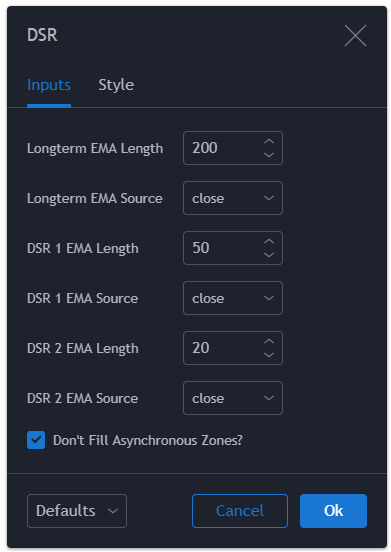
Longterm EMA Length:
This sets the long-term EMA period for determining overall trend.
Longterm EMA Source:
This sets the source of the long-term EMA.
DSR 1 EMA Length:
This sets the period of the first short-term moving average.
DSR 1 EMA Source:
This sets the source of the first short-term moving average.
DSR 2 EMA Length:
This sets the period of the second short-term moving average.
DSR 2 EMA Source:
This sets the source of the second short-term moving average.
Don’t Fill Asynchronous Zones?
If enabled then the script will only color the EMA zones if the EMAs are in confluence (ie. if the first short-term moving average is above the second short-term moving average, and both moving averages are above the long-term moving average).


Source Code
// Created by Matthew J. Slabosz
// www.zenandtheartoftrading.com
// Last Updated: 28th September, 2020
// @version=4
study(title="Dynamic Support & Resistance", shorttitle="DSR", overlay=true)

// Get user input
emaMainLength = input(200, minval=1, title="Longterm EMA Length")
emaMainSource = input(close, title="Longterm EMA Source")
emaDSR1Length = input(50, minval=1, title="DSR 1 EMA Length")
emaDSR1Source = input(close, title="DSR 1 EMA Source")
emaDSR2Length = input(20, minval=1, title="DSR 2 EMA Length")
emaDSR2Source = input(close, title="DSR 2 EMA Source")
dontPaintInvalidZones = input(title="Don't Fill Asynchronous Zones?", type=input.bool, defval=true)

// Get EMAs
ema200 = ema(emaMainSource, emaMainLength)
ema50 = ema(emaDSR1Source, emaDSR1Length)
ema20 = ema(emaDSR2Source, emaDSR2Length)
trend = ema200 > ema50 and ema50 > ema20  // Bearish trend
invalid = dontPaintInvalidZones and (ema200 > ema50 and ema50 < ema20 or ema200 < ema50 and ema50 > ema20)  // EMAs are not synchronous

// Draw invisible plot lines required for zone color fill
z1 = plot(ema20, color=na, transp=100)
z2 = plot(ema50, color=na, transp=100)

// Fill zone
fill(z1, z2, color=trend ? color.red : invalid ? color.white : color.lime, transp=75)

// Draw long-term EMA
plot(ema200, color=trend ? color.red : invalid ? color.white : color.green, linewidth=2, transp=0)
Last Updated: 28th September, 2020


I want to Fill Asynchronous Zones with color Yellow can you help me with the code please
Love your indicators! Thanks for all the free content you put out there!
Cheers! You’re most welcome, what I do is a labor of love so no need to thank me but I definitely appreciate it :)