Colored EMA Indicator
This is a modified version of the exponential moving average indicator. The only difference is that it changes color based on price action.
How It Works
When the closing price is above the EMA, the EMA will turn green for bullish.
When the closing price is below the EMA, the EMA will turn red for bearish.
Settings
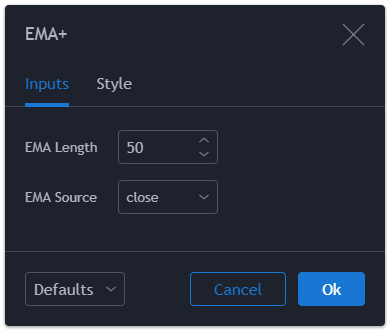
EMA Length:
This sets the calculation period of the Exponential Moving Average.
EMA Source:
This sets the data source of the Exponential Moving Average.


Source Code
// Created by Matthew J. Slabosz
// www.zenandtheartoftrading.com
// Last Updated: 28th September, 2020
// @version=4
study(title="Colored EMA", shorttitle="EMA+", overlay=true)

// Strategy settings
emaLength = input(50, minval=1, title="EMA Length")
emaSource = input(close, title="EMA Source")

// Get EMA and plot it
ema = ema(emaSource, emaLength)
plot(ema, color=close[1] > ema and close > ema ? color.green : color.red, linewidth=2)
Last Updated: 28th September, 2020


This is awesome – exactly what I am looking for – thank you!!
Apart from changing ‘study’ to ‘strategy’, can you help me with the buying and selling lines of code so I can backtest this? Thank you for any help/
Justin
how would i add alert function to when the color changes from green to red?
sell=ta.crossunder(close,ema)
buy=ta.crossover(close,ema)
alertcondition(buy, title=”Bullish”, message= “Price crossed over EMA”
alertcondition(sell, title=”Bearish”, message= “Price crossed below EMA”
This code should work in a version=5 indicator.
plot(normalisedAdx, color=normalisedDirPlus[1] > normalisedDirMinus and normalisedDirPlus > normalisedDirMinus ? color.green : color.red, linewidth=2)
I am working with this on an ADX, but i was wondering if there is a way to get a bit more detailed with the color gradient so it was a slightly smoother transition between colors. so like a nice red when DI- > Di+, and orange when they are ‘close’ to each other and green when Di+ > DI-