Trend Strength Indicator
This indicator uses Heiken Ashi candle data to plot trend/momentum strength signals to your chart.
It is an experimental indicator I created a while ago to play around with the idea of merging Heiken Ashi candle data with regular price action data.
I do not personally use this script for my live trading as I have not backtested its various use cases, but I plan to get around to doing it eventually as I believe the concept has potential to be useful for trade management.
How It Works
Bright Green: Heiken Ashi candle data is still putting in higher lows and higher highs, and the price closed above the previous low.
Dark Green: Heiken Ashi candle closed green, but had a lower low or lower high (trend/momentum weakening).
Bright Red: Heiken Ashi candle data is still putting in lower lows and lower highs, and the price closed below the previous high.
Dark Red: Heiken Ashi candle closed red, but had a higher low or higher high (trend weakening).
Optional: I included a setting for allowing high RSI values to overrule Heiken Ashi values (enabled by default).
Settings
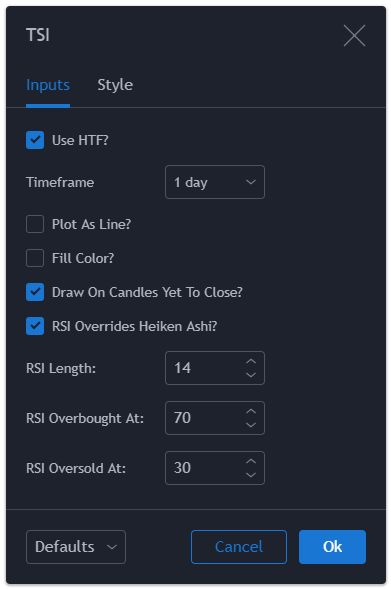
Use HTF?
If this is enabled then the indicator will use higher-timeframe data to make its calculations.
Timeframe:
If Use HTF is enabled then this is the timeframe that will be used.
Plot As Line?
If this is enabled then the script will draw the trend-strength oscillator as a line instead of squares.
Fill Color?
If this is enabled then the indicator box will be filled with the appropriate color (instead of small squares).
Draw On Candles Yet to Close?
If this is disabled then the script will not draw its signal on the current candle until the candle closes.
RSI Overrides Heiken Ashi?
If this is enabled, then when the RSI is overbought or oversold the momentum strength will read as very strong and override whatever the Heiken Ashi candle is doing.
RSI Length:
This sets the RSI length for RSI overrides.
RSI Overbought At:
This sets the RSI overbought threshold.
RSI Oversold At:
This sets the RSI oversold threshold.


Source Code
// Created by Matthew J. Slabosz
// www.zenandtheartoftrading.com
// @version=3
study("MJS - Trend Strength Indicator", shorttitle="TSI")

// Get user input
plotType = input(title="Plot As Line?", defval=false, type=bool)
sizeType = input(title="Fill Color?", defval=false, type=bool)
rsiOverride = input(title="RSI Overrides Heiken Ashi?", defval=true, type=bool)
rsiLength = input(title="RSI Length:", defval=14, minval=1, type=integer)
rsiOB = input(title="RSI Overbought At:", defval=70, minval=1, type=integer)
rsiOS = input(title="RSI Oversold At:", defval=30, minval=1, type=integer)
offset = input(title="Draw Offset:", defval=-1, type=integer)

// Color data
hkRed = #CC0000
hkRedTrend = #FF0000
hkGreen = #00CC00
hkGreenTrend = #00FF00

// Heiken Ashi data
hkopen = security(heikenashi(tickerid), period, open)
hkhigh = security(heikenashi(tickerid), period, high)
hklow = security(heikenashi(tickerid), period, low)
hkclose = security(heikenashi(tickerid), period, close)

// Momentum analysis
rsi = rsi(security(tickerid, period, close[1]), rsiLength)
bullish = hkclose[1] > hkopen[2] or (rsiOverride and rsi >= rsiOB)
bearish = hkclose[1] < hkopen[2] or (rsiOverride and rsi <= rsiOS)
bulltrend = hkhigh[1] > hkhigh[2] and hklow[1] > hklow[2] and security(tickerid, period, close[1]) > security(tickerid, period, low[2]) and bullish[1]
beartrend = hklow[1] < hklow[2] and hkhigh[1] < hkhigh[2] and security(tickerid, period, close[1]) < security(tickerid, period, high[2]) and bearish[1]

// Signal color and plot settings
signalColor = bullish ? (bulltrend ? hkGreenTrend : hkGreen) : (beartrend ? hkRedTrend : hkRed)
drawSignalOne = not plotType and not sizeType
drawSignalTwo = not plotType and sizeType
p1 = plot(drawSignalTwo ? 1 : na, transp=100, color=black, title="Fill Start")
p2 = plot(drawSignalTwo ? 0 : na, transp=100, color=black, title="Fill End")

// Plot signal
plotshape(drawSignalOne ? true : na, title="Heikin Ashi Square", location=location.absolute, color=signalColor, transp=0, size=size.auto, style=shape.square, text="", offset=offset)
plotHkClose = plot(series=plotType ? hkclose[1] : na, color=signalColor, linewidth=4, transp=0, title="Heikin Ashi Line", offset=offset)
fill(p1, p2, color=signalColor, transp=0, title="Heikin Ashi Fill")
Last Updated: 21st March, 2019

