RSI Swing Signal Indicator
This is a backtesting and live-trading tool I created for a simple price action strategy created by my mentor, Steven Hart (creator of TheTradingChannel).
The base indicator is essentially just an enhanced RSI oscillator, but it comes with a companion script that also draws signals, stops and targets directly to your chart.
With TradingView your scripts can only draw either to your chart or to an oscillator box, so I had to create two separate indicators to get the best testing and trading experience out of this script.
Table of Contents
How It Works
When the RSI gets above 80, the script will begin looking for bearish engulfing candles.
When the RSI gets below 20, the script will begin looking for bullish engulfing candles.
This is essentially a counter-trend or mean-reversion strategy. The concept behind it is simple. We are looking for price to get into an over-extended state (aka. “overbought” or “oversold”, although I find those terms to be misleading in Forex).
Once price is over-extended, then we want to wait for a sign that price is ready to mean-revert or reverse. There are other candlestick patterns that you can use to enter this type of strategy, but I find swing high/low engulfing candles to be very effective. And the bigger the rejection wick the better.
Settings (Oscillator)
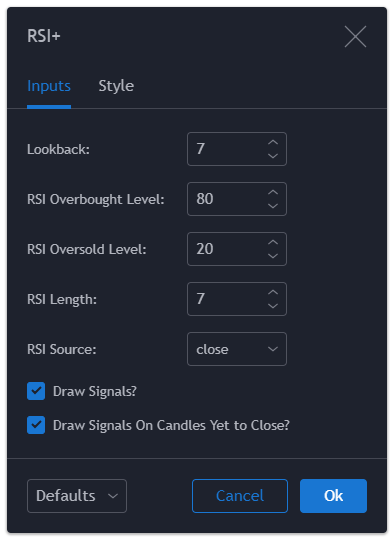
Lookback:
This sets how far the script will search back for swing highs/lows.
RSI Overbought Level:
This sets the overbought threshold.
RSI Oversold Level:
This sets the oversold threshold.
RSI Length:
This changes the calculation period of the RSI.
RSI Source:
This changes the source of the RSI calculation (ie. high, low, close).
Draw Signals?
This draws colored signals over the oscillator whenever a valid setup occurs.
Draw Signals On Candles Yet to Close?
If you disable this, the script will not draw signals on the current candle until it closes.
Settings (Chart)

Stop Loss Size (X ATR):
This sets your stop loss size/distance based on an ATR multiplier.
Reward to Risk Ratio (Stop Loss x ?):
This sets your take profit ratio compared to your stop loss. Leaving this at 1 draws signals with a 1:1 RR.
Show B/E Point?
If this is enabled, the script will draw a line to represent a break-even point (optional – useful for risk management of large RR strategies).
Reward To Risk Ratio (B/E):
This sets where your break-even point is drawn. For example, 0.5 would set it half way between your 1:1 take profit and your entry price.
Lookback:
This sets how far back the script will look for swing highs and lows.
RSI Overbought Level:
This sets the RSI overbought threshold.
RSI Oversold Level:
This sets the RSI oversold threshold.
RSI Length:
This changes the RSI calculation period.
RSI Source:
This changes the source of the RSI calculation.
Draw Signals?
If this is disabled the script will not draw signals to your chart.
Draw Signals On Candles Yet to Close?
If this is disabled the script will not draw signals on the current candle until it closes.


Source Code
Oscillator
// Created by Matthew J. Slabosz
// www.zenandtheartoftrading.com
// To create Alerts use Condition: RSI+, Frequency: Once Per Bar (on Close)
// @version=3
study(title = "MJS - RSI Swing Signal", shorttitle="RSI+", overlay = false)

// Strategy settings
lookback = input(title="Lookback:", type=integer, defval=7)
rsiob = input(title="RSI Overbought Level:", type=integer, defval=80)
rsios = input(title="RSI Oversold Level:", type=integer, defval=20)
rsilen = input(title="RSI Length:", type=integer, defval=7)
rsisrc = input(title="RSI Source:", type=source, defval=close)
drawsignals = input(title="Draw Signals?", type=bool, defval=true)
drawrt = input(title="Draw Signals On Candles Yet to Close?", type=bool, defval=true)

// Get indicator values
rsi = rsi(rsisrc, rsilen)
rsisell = rsi > rsiob
rsibuy = rsi < rsios

// Determine buy/sell signals
buysignal1 = (rsibuy or rsibuy[1]) and (close[1] < open[1] and close > open[1] and low > low[1] and low[1] < low[2] and low[1] == lowest(low, lookback)) and open <= close[1]
buysignal2 = (rsibuy or rsibuy[1]) and (close[1] < open[1] and close > open[1] and low < low[1] and low == lowest(low, lookback)) and open <= close[1]
sellsignal2 = (rsisell or rsisell[1]) and (close[1] > open[1] and close < open[1] and high > high[1] and high == highest(high, lookback)) and open >= close[1]
sellsignal1 = (rsisell or rsisell[1]) and (close[1] > open[1] and close < open[1] and high < high[1] and high[1] > high[2] and high[1] == highest(high, lookback)) and open >= close[1]

// Paint signals
bgcolor(buysignal1 ? lime : (sellsignal1 ? red : na), transp=0, title="123 Fractal")
bgcolor(buysignal2 ? lime : (sellsignal2 ? red : na), transp=0, title="Swing Fractal")
plot(rsi, title="RSI", color=(rsisell ? red : (rsibuy ? lime : #4985e7)), linewidth=2, transp=0)
plot(rsiob, title="RSI Overbought", color=red, transp=0)
plot(rsios, title="RSI Oversold", color=green, transp=0)

// Send out an alert if this candle meets our conditions
alertcondition((sellsignal1 or sellsignal2) or (buysignal1 or buysignal2), title="RSI SIGNAL", message="RSI Exhaustion signal for XXXX")
Chart
// Created by Matthew J. Slabosz
// www.zenandtheartoftrading.com
// @version=3
study(title = "MJS - RSI Swing Signal (Chart)", shorttitle="RSI+", overlay = true)

// Strategy settings
stopLossInput = input(1.0, minval=0.1, title="Stop Loss Size (x ATR):")
riskToReward = input(1.0, minval=0.1, title="Reward To Risk Ratio (Stop Loss X ?):")
showBE = input(title="Show B/E Point?", type=bool, defval=false)
riskToRewardBE = input(0.8, minval=0.1, title="Reward To Risk Ratio (B/E):")
useAtrAlgo = input(title="Use ATR Stop Loss Algorithm?", type=bool, defval=false)
lookback = input(title="Lookback:", type=integer, defval=7)
rsiob = input(title="RSI Overbought Level:", type=integer, defval=80)
rsios = input(title="RSI Oversold Level:", type=integer, defval=20)
rsilen = input(title="RSI Length:", type=integer, defval=7)
rsisrc = input(title="RSI Source:", type=source, defval=close)
drawsignals = input(title="Draw Signals?", type=bool, defval=true)
drawrt = input(title="Draw Signals On Candles Yet to Close?", type=bool, defval=true)
decimals = abs(log(syminfo.mintick) / log(10))
currentATR = atr(14)

// Perform ATR stop loss calculations
atrWhole = currentATR
if(decimals == 5)
    atrWhole := currentATR * 10000
if(decimals == 4)
    atrWhole := currentATR * 1000
if(decimals == 3)
    atrWhole := currentATR * 100
if(decimals == 2)
    atrWhole := currentATR * 10
stopSizeX = 200 // If atr < 30, stop size = 20
if(atrWhole >= 30 and atrWhole < 50)
    stopSizeX := 300
if(atrWhole >= 50 and atrWhole < 100)
    stopSizeX := 500
if(atrWhole >= 100)
    stopSizeX := 1000
stopSizeAlgo = stopSizeX * syminfo.mintick

// Calculate stop loss info
stopSize = currentATR * stopLossInput

// Detect RSI signal
rsi = rsi(rsisrc, rsilen)
rsisell = rsi > rsiob
rsibuy = rsi < rsios

// Determine whether or not this candle is a buy or sell signal
buysignal1 = (rsibuy or rsibuy[1]) and (close[1] < open[1] and close > open[1] and low > low[1] and low[1] < low[2] and low[1] == lowest(low, lookback)) and open <= close[1]
buysignal2 = (rsibuy or rsibuy[1]) and (close[1] < open[1] and close > open[1] and low < low[1] and low == lowest(low, lookback)) and open <= close[1]
sellsignal1 = (rsisell or rsisell[1]) and (close[1] > open[1] and close < open[1] and high < high[1] and high[1] > high[2] and high[1] == highest(high, lookback)) and open >= close[1]
sellsignal2 = (rsisell or rsisell[1]) and (close[1] > open[1] and close < open[1] and high > high[1] and high == highest(high, lookback)) and open >= close[1]
longEntrySize = (close - lowest(low, 3)) + (useAtrAlgo ? stopSizeAlgo : stopSize)
shortEntrySize = (highest(high, 3) - close) + (useAtrAlgo ? stopSizeAlgo : stopSize)

// Prepare stop and target values
tradeStopPrice = 0.0
tradeStopPrice := tradeStopPrice[1]
tradeTargetPrice = 0.0
tradeTargetPrice := tradeTargetPrice[1]
tradeBreakEvenPrice = 0.0
validLong = buysignal1 or buysignal2
validShort = sellsignal1 or sellsignal2

// Store long position info
if(validLong)
    tradeStopPrice := close - longEntrySize
    tradeTargetPrice := close + (longEntrySize * riskToReward)
    tradeBreakEvenPrice := close + (longEntrySize * riskToRewardBE)
// Store short position info
if(validShort)
    tradeStopPrice := close + shortEntrySize
    tradeTargetPrice := close - (shortEntrySize * riskToReward)
    tradeBreakEvenPrice := close - (shortEntrySize * riskToRewardBE)

// Plot candlestick patterns
plotshape(validLong and (barstate.ishistory or drawrt), title= "Bullish Engulfing", location=location.belowbar, color=green, transp=0, style=shape.triangleup, text="")
plotshape(validShort and (barstate.ishistory or drawrt), title= "Bearish Engulfing", location=location.abovebar, color=red, transp=0, style=shape.triangledown, text="")

// Draw stops & targets
plot((validLong or validLong[1]) ? (validLong ? tradeStopPrice : tradeStopPrice[1]) : na, title="Long Stop Price", color=red, style=linebr, transp=0)
plot((validShort or validShort[1]) ? (validShort ? tradeStopPrice : tradeStopPrice[1]) : na, title="Short Stop Price", color=red, style=linebr, transp=0)
plot((validLong or validLong[1]) ? (validLong ? tradeTargetPrice : tradeTargetPrice[1]) : na, title="Long Target Price", color=green, style=linebr, transp=0)
plot((validShort or validShort[1]) ? (validShort ? tradeTargetPrice : tradeTargetPrice[1]) : na, title="Short Target Price", color=green, style=linebr, transp=0)
plot((validLong or validLong[1]) and showBE ? (validLong ? tradeBreakEvenPrice : tradeBreakEvenPrice[1]) : na, title="Long Break-Even Price", color=blue, style=linebr, transp=0)
plot((validShort or validShort[1]) and showBE ? (validShort ? tradeBreakEvenPrice : tradeBreakEvenPrice[1]) : na, title="Short Break-Even Price", color=blue, style=linebr, transp=0)

// Send out an alert if this candle meets our conditions
alertcondition((sellsignal1 or sellsignal2) or (buysignal1 or buysignal2), title="RSI SIGNAL CHART", message="RSI Exhaustion signal for XXXX")
Last Updated: 21st March, 2019

