Pine Script – Lesson 7: How To Create ATR Trailing Stop


Table of Contents
How To Use the ATR Indicator
NOTE: This lesson is out-dated and for Version 4 syntax. To see my latest FREE Pine Script V5 lessons complete with source code, check out my YouTube Pine Script Tutorials page.
Almost every complex trading script on the planet uses the ATR indicator’s value to make its calculations in some way or another.
In today’s Pine Script lesson we’re going to create an ATR trailing stop indicator to demonstrate how to use it in our custom scripts:
By using the inbuilt ATR indicator function, we can get the current ATR value and use it to inform our script – be it through calculating stop loss and targets, adjusting to volatility, or anything else you’d normally do with an ATR indicator in your strategies.
Each of these lessons build on previous lessons, so if there are any concepts or lines of code in this lesson that you don’t understand, please go back through the related previous lessons (such as how to plot data to your chart and how to get basic user input).
If you’re unfamiliar with the ATR or the many ways it can be used to enhance your strategies, then you will find this article extremely helpful.
And as always, the complete source code for this lesson is available at the end.
Video Lesson
If you prefer to learn in a visual/audio manner, then here’s a video version of this lesson:
Step 1: Getting the ATR Indicator’s Value
The first step in working with the ATR in Pine Script is to simply retrieve the current ATR value.
With Pine Script being the amazing coding language that it is, we can achieve this using one very simple line of code:
atr = atr(atrLength)
The default ATR indicator’s lookback length is 14 bars, so we can assign the atrLength to 14 by default.
As always, it’s best practice to allow your script users to adjust these settings to their preference, so we’re going to use the input function to assign the default variable:
atrLength = input(title="ATR Length", type=input.integer, defval=14, minval=1)
Because we’re using a whole number as the ATR lookback length, we need to set the input type to “integer”.
And don’t forget – because we’re plotting this data directly to the chart instead of into its own indicator box, as I mentioned in previous lessons, we need to set “overlay” to true.
And in order to avoid errors when compiling the script, we need to have at least one plot() function in the script. For now, we’ll just leave this as plot(close) to draw the closing price to our chart and we’ll change it later.
So your initial script should look something like this:
//@version=4
study("Lesson 7", overlay=true)

// Get inputs
atrLength = input(title="ATR Length", type=input.integer, defval=14, minval=1)

// Calculate data
atr = atr(atrLength)

// Draw data to chart
plot(close)
Step 2: Detecting Swing Lows & Highs
In order to create a trailing stop we have two options.
We can either trail the ATR above or below the current closing price, or we can trail it above or below structure.
Trailing it above or below the closing price is easy – we simply add or subtract the current ATR value from the current closing price. But if we want to use structure, then we’re going to need to detect the most recent swing highs and lows.
I demonstrated how to achieve this in Lesson 2, and finding the nearest high or low over a set lookback period is extremely simple. First we need to define how many bars we want to search back, and then we need to get the highest high and lowest low over that period.
So to begin with we need to create two more inputs – a boolean input for determining which option we want to use (the closing price or structure – set to true by default), and the lookback period for detecting structure:
useStructure = input(title="Use Structure?", type=input.bool, defval=true)
lookback = input(title="How Far To Look Back For High/Lows:", type=input.integer, defval=7, minval=1)
Now that we have the lookback value (7 bars by default), we can use it to determine how far to search back over historical price action for swing highs and lows.
We achieve this by using the inbuilt highest() and lowest() functions:
highestHigh = highest(high, lookback)
lowestLow = lowest(low, lookback)
After adding these few lines of code, your script should now look something like this:
//@version=4
study("Lesson 7", overlay=true)

// Get inputs
atrLength = input(title="ATR Length", type=input.integer, defval=14, minval=1)
useStructure = input(title="Use Structure?", type=input.bool, defval=true)
lookback = input(title="How Far To Look Back For High/Lows:", type=input.integer, defval=7, minval=1)

// Calculate data
atr = atr(atrLength)
highestHigh = highest(high, lookback)
lowestLow = lowest(low, lookback)
We now have all the information we need to create a trailing stop – except for one last thing: the ATR multiplier.
Step 3: Adding An ATR Multiplier
Most strategies and scripts will require an ATR multiplier in their calculations as not everyone uses a default 1 ATR value in their stop loss or target placement.
But before we can add a multiplier to our code, we need to create an ATR multiplier input that gets a floating point decimal number from the user, like so:
atrStopMultiplier = input(title="ATR Multiplier", type=input.float, defval=1.0, minval=0.1)
The input type “input.float” means that our users can input any number with a decimal. So for example, if they want to use a half ATR multiplier to draw the ATR half of the standard distance away, they can type in 0.5.
By default we’ll leave it at 1 (defval=1.0) and we’ll set a minimum value of 0.1 (minval=0.1). This minimum value is optional, but it’s a good opportunity to demonstrate the minval parameter.
Now we have everything we need to begin performing the actual trailing stop calculation, and your script should look something like this:
//@version=4
study("Lesson 7", overlay=true)
// Get inputs
atrLength = input(title="ATR Length", type=input.integer, defval=14, minval=1)
useStructure = input(title="Use Structure?", type=input.bool, defval=true)
lookback = input(title="How Far To Look Back For High/Lows", type=input.integer, defval=7, minval=1)
atrStopMultiplier = input(title="ATR x ?", type=input.float, defval=1.0, minval=0.1)
// Calculate data
atr = atr(atrLength)
highestHigh = highest(high, lookback)
lowestLow = lowest(low, lookback)
// Plot data to the chart
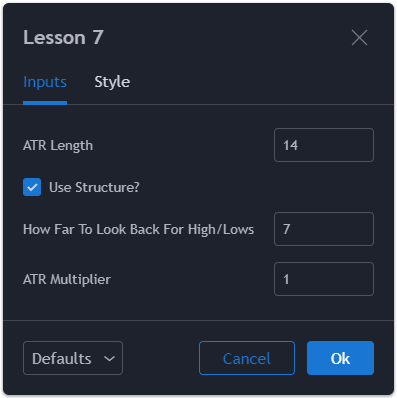
plot(close)And we can now adjust these settings to whatever we desire in the options menu, which should look like this:
Step 4: Calculating The Trailing Stop Price
The final step of our ATR trailing stop calculation is to combine all of these variables we’ve created to determine the trailing stop price.
We can achieve this in two lines of code using the convenient “conditional operator”:
longStop = (useStructure ? lowestLow : close) - atr * atrStopMultiplier
shortStop = (useStructure ? highestHigh : close) + atr * atrStopMultiplier
The conditional operator is represented by the question mark symbol (?) and the colon symbol (:). The ? represents “if”, the : represents “else” or “otherwise”.
It can seem confusing if you’re a beginner, but don’t worry, it’s not that hard to understand and will just require some practice to become familiar with the concept.
The ? symbol in Pine Script represents a condensed if / else statement. If the boolean preceding the ? is true, then the first value is used. Otherwise, the second value is used. In this case, “otherwise” (or “else”) is represented by the colon symbol (:).
So in algebraic terms, the longStop line of code above is saying:
Assign longStop’s value to X, where X is set to the lowestLow if useStructure is true OR is set to the closing price if useStructure is false.
Either way, the result is a price value. We get the lowest low price, or the closing price.
If that’s confusing, then another way of presenting this line of code is like this:
if useStructure
    longStop := lowestLow - atr * atrStopMultiplier
else
    longStop := close - atr * atrStopMultiplier
In any case – once we have that lowestLow or closing price value, we simply add to it or subtract it by the current ATR multiplied by the ATR multiplier value.
For a Long trailing stop we want it below price, so we subtract it – for a Short trailing stop we want it above price, so we add to it.
After adding these two lines of code, your script should look like this:
//@version=4
study("Lesson 7", overlay=true)

// Get inputs
atrLength = input(title="ATR Length", type=input.integer, defval=14, minval=1)
useStructure = input(title="Use Structure?", type=input.bool, defval=true)
lookback = input(title="How Far To Look Back For High/Lows:", type=input.integer, defval=7, minval=1)
atrStopMultiplier = input(title="ATR x ?", type=input.float, defval=1.0, minval=0.1)

// Calculate data
atr = atr(atrLength)
longStop = (useStructure ? lowestLow : close) - atr * atrStopMultiplier
shortStop = (useStructure ? highestHigh : close) + atr * atrStopMultiplier

// Draw data to chart
plot(close)
Step 5: Drawing The Trailing Stop to Your Chart
The script is almost complete, but the final step is to draw these values to our actual chart.
This part is easy – all we need to do is replace plot(close) with 2 new plots, like so:
plot(longStop)
plot(shortStop)
If you add those two lines of code to your chart, the script will now plot your trailing stop price to the chart for both Long positions and Short positions.
But what if we want to know the current ATR value without having 2 indicators on our chart (this indicator and the ATR indicator)?
We already have the ATR value, so we might as well plot this to our chart too. And what if you want to change the color of the Long trailing stop (below price) to green, and the Short trailing stop (above price) to red?
First of all, if you plot the ATR to your chart then on some instruments with a price range that is similar to the ATR value, it will actually show up on your price action chart as a random black line.
So if we’re going to draw the value to the chart, we must make it transparent:
plot(atr, color=color.blue, title="ATR", transp=100)
And finally, to change the colors of our trailing stops, we just need to adjust our plot() functions to look like this:
plot(longStop, color=color.green, title="Long Trailing Stop", transp=0)
plot(shortStop, color=color.red, title="Short Trailing Stop", transp=0)
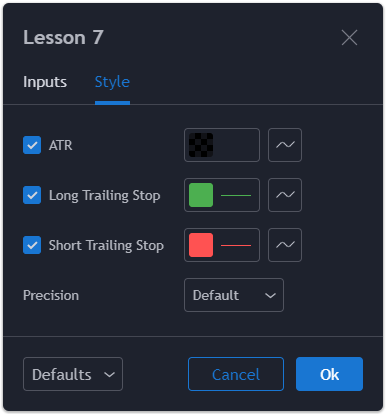
Notice that I’ve titled the plots using the “title” parameter. If you do this, it will allow you to adjust these values in the settings menu, which looks like this when you open your indicator’s options:
Congratulations! Now our script is finally complete, and you have your first trailing stop indicator script.
If you add it to your chart, it should look something like this:
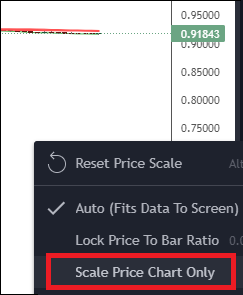
How to Fix Chart Scale
If you add this script to your chart and your price data gets all squished and weird-looking, make sure you’ve set your price axis to “Scale Price Chart Only”, like this:
Advanced Course
If you want to take your Pine Script coding to the next level, then I think you’ll be interested in my Pine Script Mastery Course.
If you liked this free content then I promise that you’ll love my premium content where I am able to go into much greater detail and help answer students’ questions!
Source Code
// This source code is subject to the terms of the Mozilla Public License 2.0 at https://mozilla.org/MPL/2.0/
// © ZenAndTheArtOfTrading

//@version=4
study("Lesson 7", overlay=true)

// Get inputs
atrLength = input(title="ATR Length", type=input.integer, defval=14, minval=1)
useStructure = input(title="Use Structure?", type=input.bool, defval=true)
lookback = input(title="How Far To Look Back For High/Lows", type=input.integer, defval=7, minval=1)
atrStopMultiplier = input(title="ATR Multiplier", type=input.float, defval=1.0, minval=0.1)

// Calculate data
atr = atr(atrLength)
lowestLow = lowest(low, lookback)
highestHigh = highest(high, lookback)
longStop = (useStructure ? lowestLow : close) - atr * atrStopMultiplier
shortStop = (useStructure ? highestHigh : close) + atr * atrStopMultiplier

// Draw data to chart
plot(atr, color=color.blue, title="ATR", transp=100)
plot(longStop, color=color.green, title="Long Trailing Stop", transp=0)
plot(shortStop, color=color.red, title="Short Trailing Stop", transp=0)OVERVIEW

Really really great stuff Matt, thanks so much for your time on this.
Steve
Unless I’m mistaken this code will never hit the trailing stop because your always referencing the latest high or low in the calculation. You could just create a separate series of lows/highs that are offset by x bars.
offset = 5
lows = low[offset]
lowest_low = lowest(lows, lookback)
Hi tmyers! You’re correct, this script will never actually hit the trailing stop. That’s because the script doesn’t know where you entered your trade, so the way I personally use this script is to trail my stop loss only higher for long trades or only lower for short trades.
Meaning that when the trailing stop lowers for a long trade, I do not lower my trailing stop. I just use those levels to lock in wherever the trailing stop was when it was at its highest point during the long trade I was involved in. If that makes sense
And how the fuck do you plot that on the chart?
You need to either add an input to the script that tells it what date & time to start trailing from, or you need to make the script detect your entry patterns and trail after an entry setup is detected
Hi Matthew – Your website should be called Zen and the Art of Teaching Trading. You do a great job of laying out your content and explaining things thoroughly. Thank you for making this video. I’m looking forward to watching your other lessons.
While this lesson shows how to plot the trailing stop, how do you implement it in code to only move the stop up whenever a long stop indicator moves up? Is this found in other lessons?
Thanks again.
Thanks for the kind words Chris! I actually have a video lesson covering this subject coming out on Thursday, so make sure you’re subscribed to my YouTube channel – https://www.youtube.com/channel/UC1QOuvOFsf3YvF64ritAoeg
Good luck with your trading :)
Can you please tell me in which video you cover this? Im having trouble implementing this
This is exactly what I was looking for to take my script to the next level! Thank you!
Hi thanks for this. When I use the source code to create an indicator my price chart goes all flat. Please see screen capture attached, thanks much!
Hi and thanks for the script. I’d like to calculate ATR from the lows or highs, how could I get it?
hello
Thank you for guiding me
Using your code, I upgraded my strategy, which trades in both long and short directions, to exit the strategy, and at the same time, I used stop-loss and trailing stop, which worked well in the long direction, but in the short direction, it immediately restarted. Closing any position closes that position
Thank you again for your valuable lessons
Hi guys. What is wrong with this ATR code. I get an error “Too many arguments.
atr = ta.atr(source, ta.atr(10))