Pine Script – Lesson 3: Basic User Inputs


Table of Contents
How to Work With User Inputs
NOTE: This lesson is out-dated and for Version 4 syntax. To see my latest FREE Pine Script V5 lessons complete with source code, check out my YouTube Pine Script Tutorials page.
Most indicators you make will not be suited to permanently hard-coded variables. Often you will want to change certain settings on the fly such as the lookback period, the timeframe, overbought/oversold thresholds, etc.
Luckily, Pine Script makes it extremely easy to work with user inputs through their generic script settings interface.
For this lesson I will explain how to add basic input settings to our high/low channel script.
Video Lesson
If you prefer to learn in a visual/audio manner, then here’s a video version of this lesson:
Getting User Input
First, add this line to your script, right below the study() line:
lookback = input(title="Lookback Period", type=input.integer, defval=50)
This is saying to Pine Script “create a variable named lookback with the type of integer, and assign it to whatever the user sets it to”.
In this case, title=”Lookback Period” sets the text description in the script interface, type=integer says to treat this input as a number, and defval=50 says set the default value to 50.
Now we must tell Pine Script what to do with this number. Change these two lines in your code to look like this:
highestHigh = highest(high, lookback)
lowestLow = lowest(low, lookback)
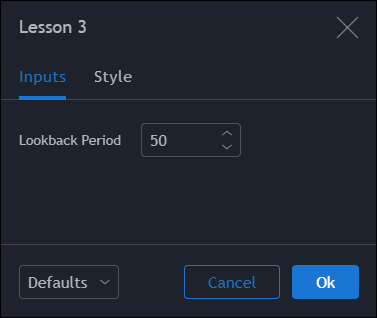
If you save the script and add it to your chart, you will now be able to change the lookback period in the settings. Click the settings icon next to the indicator title on your chart and this window will appear:
Now if you change this setting the script will adjust the lines to the new lookback period. For example, if you set this number to 100, the chart would look like this:

And there you have it. With this simple Pine Script example, you have the beginnings of an adaptable indicator. Getting user inputs for timeframes, numbers, text, booleans (true/false/checkboxes), etc. is a breeze.
I will demonstrate how to use more complex user inputs in later lessons, but for now this is a great start and covers a lot of basic use cases.
Advanced Course
If you want to take your Pine Script coding to the next level, then I think you’ll be interested in my Pine Script Mastery Course.
If you liked this free content then I promise that you’ll love my premium content where I am able to go into much greater detail and help answer students’ questions!
Source Code
//@version=4
study("Lesson 3", overlay=true)
lookback = input(title="Lookback Period", type=input.integer, defval=50)
highestHigh = highest(high, lookback)
lowestLow = lowest(low, lookback)
plot(highestHigh, color=color.red, linewidth=2)
plot(lowestLow, color=color.blue, linewidth=2)OVERVIEW

it is instructive, but the text of Lesson 3 is a repetition of Lesson 2
That is to make the lesson easier to digest rather than creating an entire new use-case since this lesson is about adding user input to the previous script :) if you’d like far more detailed lessons than this text lesson then check out my free course at http://www.pinescriptbasics.com
I’m learning a lot, well done, sometimes a little to fast for beginners thanks