July 2019 Review
Table of Contents
Forex Trading Review – Week 31
This week was another slow one. I took 7 trades, 5 lost (in a row yet again), 1 broke even and 1 hit my profit target.
I ended the month in a rather nasty double-digit drawdown, but as I’ve mentioned in my previous two journal entries – it’s nothing to worry about yet from a statistical perspective, and it’s a perfectly natural part of systematic trading.
So all I can do is trust in my plan which I know has an edge, and continue to execute consistently despite the frustration and pain of several weeks of losses.
No one likes to lose, especially traders. But it’s a part of any game, and especially trading. So I just need to suck it up, stay focused and continue to perform my duties – which is to execute my plan consistently and do my best not to sabotage myself by making poor emotionally-charged decisions.
The only way out is through.
29th July – 2nd August
Trade #144
| Market | USD/CAD |
| Date & Time | 29/7/19 9:00 AM |
| Daily Trend | Bullish |
| Timeframe | 1HR |
| Strategy | Pullback |
| Result | -1.00% |
| Verdict | Good Trade |

Before 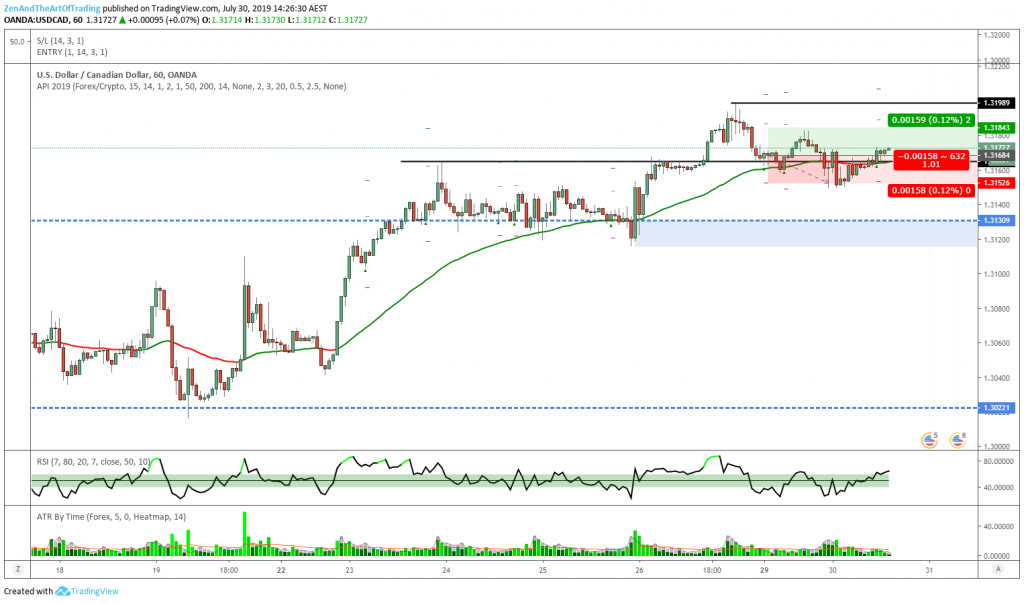
After
Reflection:
This was an attempted trend-continuation play.
Price was clearly making higher highs and higher lows, and the Daily chart had just broken and closed above previous resistance-in-trend, which looks something like this and is a potential sign of a reversal:
In this pattern, price action is making lower lows and lower highs as it ebbs and flows to the downside. So long as price does not break and close above the swing high preceeding a fresh structure low breakout (the red line in this example), then the down-trend is intact.
As soon as we get a break and close above that red line the trend is considered finished and we are entering a period of either consolidation or a potential reversal.
You can see this pattern occurring here on the Daily chart:
However, price was also testing the 50-EMA as resistance. So unfortunately this trade did not play out, this breakout failed and pulled back to consolidate before continuing higher.
Even now, a week later, price is still struggling at the 50-EMA. Price did find support at previous resistance and moved higher since this trade, but not before stopping me out for a loss and since as traders we don’t get any points for being right, this was still a losing trade despite my correct analysis.
But it was also a Good Trade according to my rules, so there’s nothing to sulk about with this loss. You can’t win them all, and even the best-looking setups fail sometimes.
Trade #145
| Market | EUR/USD |
| Date & Time | 30/7/19 2:30 PM |
| Daily Cond. | At Major Support |
| Timeframe | 1HR |
| Strategy | Pullback |
| Result | +0.52% |
| Verdict | Good Trade |
Before 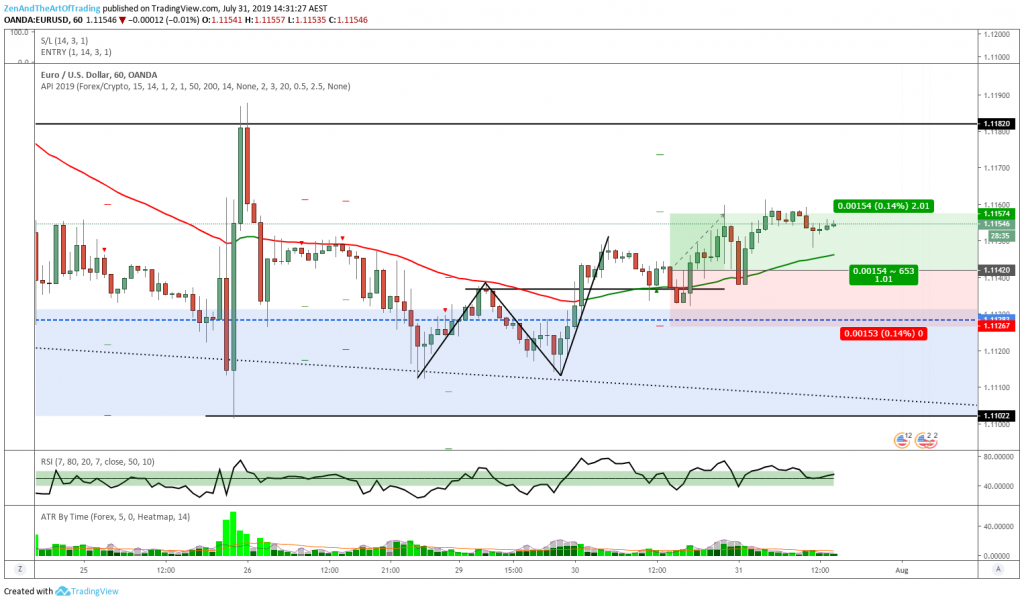
After
Reflection:
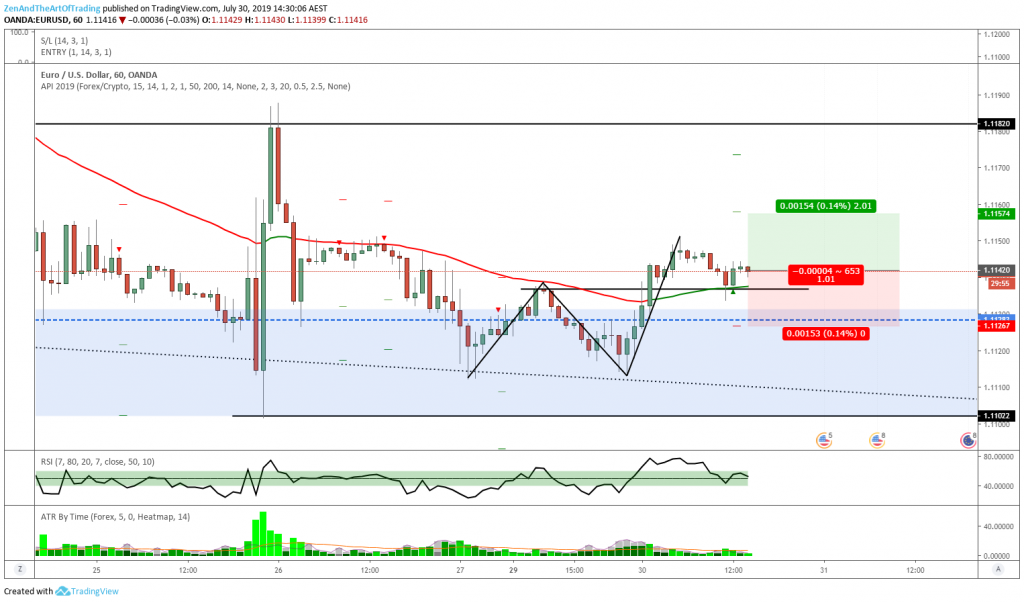
This was a reversal situation occurring on EUR/USD after a test of very major Daily support.
Once we got this 1-2-3 move that formed a higher high and broke above the 50-EMA convincingly, I expected the previous high to act as support in confluence with the 50-EMA – and that’s exactly what we got.
Price bounced from that zone to hit my first target and then reversed to re-test the EMA, stopping me out for break-even on my second position. But that’s okay – it was worth a shot at trying to capture a trend reversal at its early stages.
Trade #146
| Market | EUR/JPY |
| Date & Time | 30/7/19 4:00 PM |
| Daily Trend | Bearish |
| Timeframe | 15M |
| Strategy | Pullback X |
| Result | -0.99% |
| Verdict | Good Trade |
Before 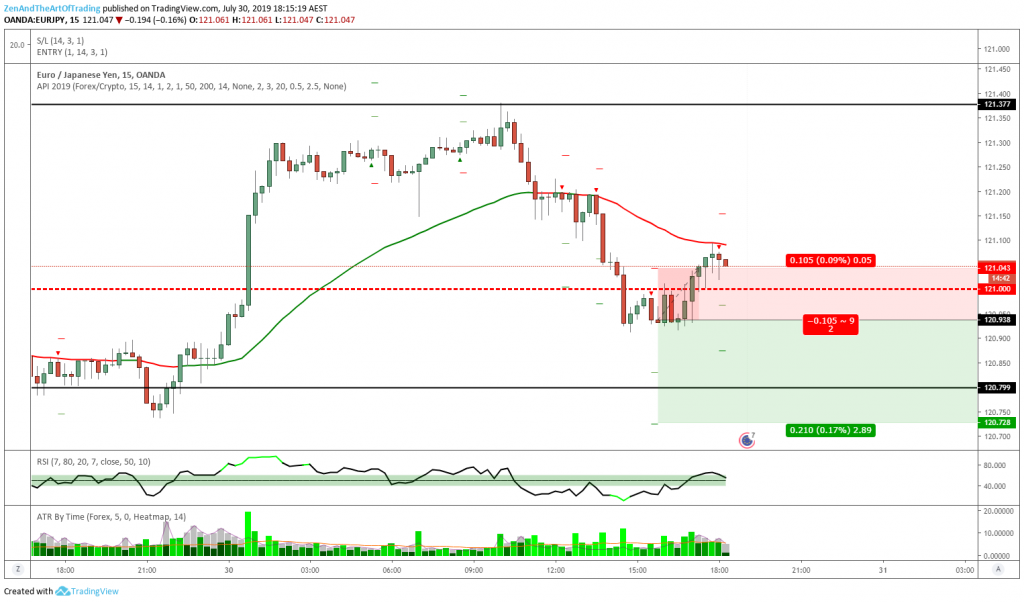
After
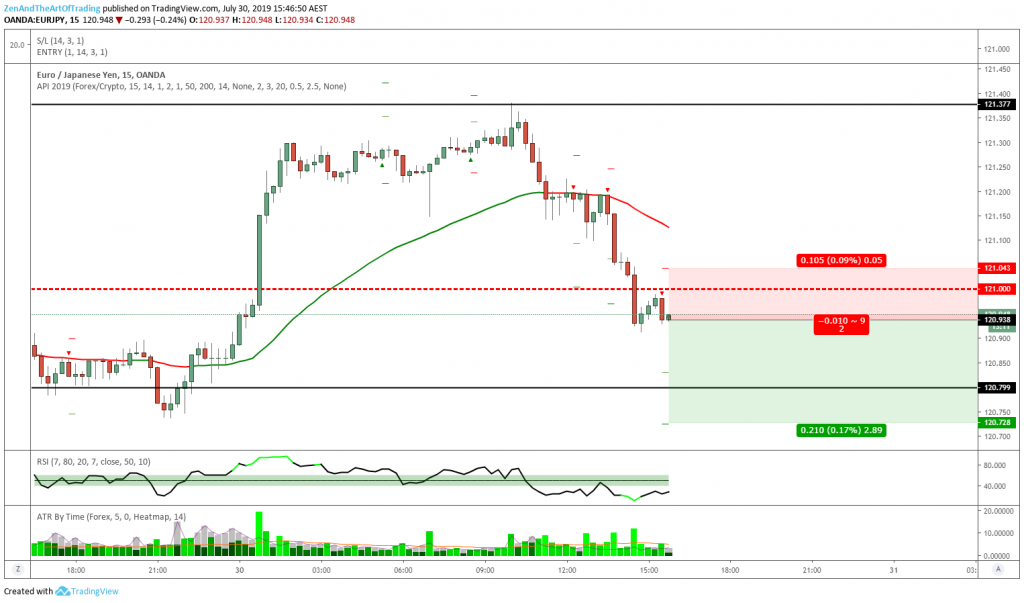
Reflection:
This was a momentum setup. Price had failed to sustain the large rally from the night before, and had plummeted below the 50-EMA and broke several minor support levels to the downside and was holding below a major Daily resistance zone.
Unfortunately there was a deeper pullback before price moved lower, which stopped me out for a small loss on this trade. Good Trade nonetheless and I couldn’t have done anything differently according to my trading plan.
Trade #147
| Market | EUR/JPY |
| Date & Time | 30/7/19 6:15 PM |
| Daily Trend | Bearish |
| Timeframe | 15M |
| Strategy | Pullback X |
| Result | B/E |
| Verdict | Good Trade |
Before 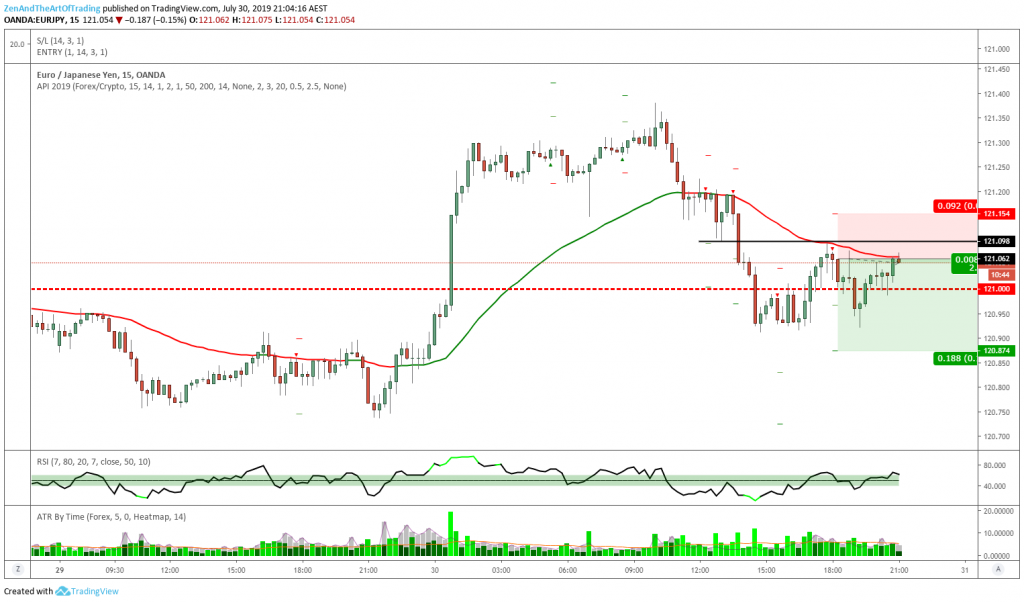
After
Reflection:
Immediately following the loss on the previous trade, price gave me a second chance entry. This is a great example of how you can turn “revenge trading” into a positive thing.
I did not take this trade with a revengeful attitude, it was simply another trade that met my rules. But the way my trading plan is set up allows me to take second-chance trades on high-probability setups that fail.
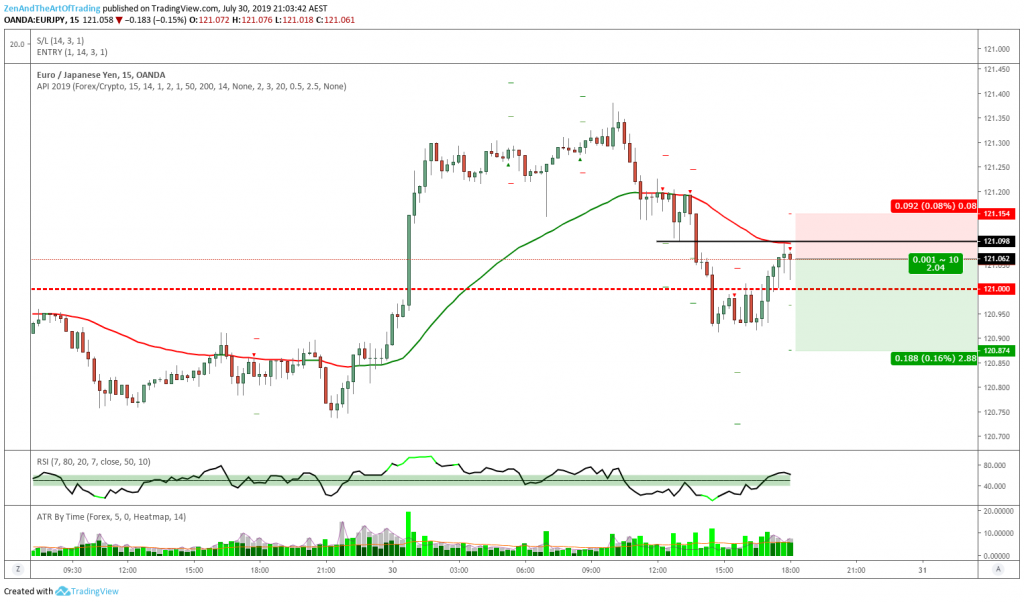
When price stopped me out on the first attempt, my rules then state that I must wait until price retests the 50-EMA. If price tests the 50-EMA and gives me a second valid entry pattern (in this case a swing-high engulfing candle), then I can take a second stab at the same swing in the market.
In this case price stopped me out for break-even on this second trade, but I have had many instances in the past where the second trade plays out profitably and makes up for the initial loss (which is why I have this caveat in my trading plan).
What’s interesting about this rule is that it technically allows me to “revenge trade”. In other words, it allows me to take a second trade on the “same” setup. In this case, the setup is slightly different, but both trades were trying to capture the same move.
Normally taking multiple trades to capture a single swing in the markets is a very dangerous activity (if you don’t have an edge). But for me and my trading plan, this was just another trade that met my rules and so I was perfectly free to take 2 trades on the same trade idea.
Just some food for thought for newer traders who might be reading this and who might be struggling with regret and feelings of revenge when missing moves or taking multiple losses trying to capture the same move.
If you struggle with this, then consider systematizing your revenge trading in a way that maintains your edge and does not jeopardize your long-term expectancy. In other words, if missing trades or revenge trading bothers you, try creating multiple rules-based entry reasons in your trading plan that allow you to vent those frustrations in a positive and constructive manner and give yourself multiple ways to effectively attack and corner a market.
Trade #148
| Market | GBP/USD |
| Date & Time | 30/7/19 9:00 PM |
| Daily Trend | Bearish |
| Timeframe | 1HR |
| Strategy | Pullback |
| Result | -0.99% |
| Verdict | Good Trade |

Before 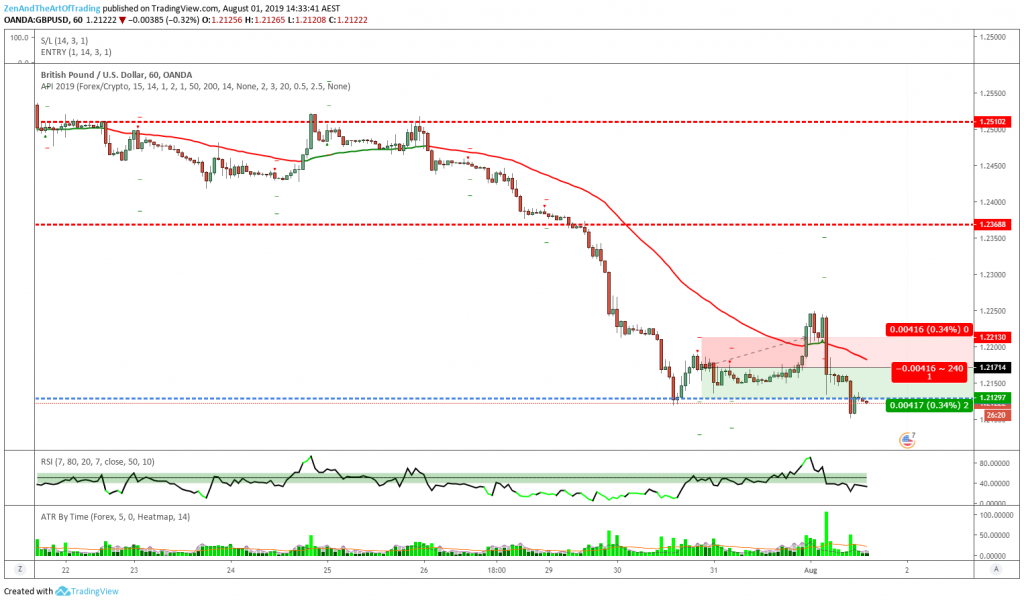
After
Reflection:
This was a hard trade to take. My trading plan does not account for higher-timeframe structure yet, but I knew this blue zone was likely to act as support for this market.
So when I got a valid pullback trade after a direct test of that zone, I was hesitant to take this trade but forced to out of dedication to consistency and trading discipline.
However I plan to analyze my past 150 trades for the year to gather data around these scenarios and prove statistically that these trades have a lower chance of winning. In this case I was hoping for a double-bottom to occur. And it did occur – but not before a sharp retracement from this zone that stopped me out.
This is an example of how you should evolve your trading plan over time based on statistical and pattern observations. I am always looking for new filters and conditions to add to my rules that will enhance my edge, and I strongly suspect for obvious reasons that this may be one such filter that should improve my expectancy.
However, I must prove that first before I implement it, through backtesting and analysis of my live trades. I will update you on how that goes, probably in its own blog post as I imagine that my next trading plan revision will be a significant one.
Trade #149
| Market | USD/JPY |
| Date & Time | 1/8/19 2:00 PM |
| Daily Trend | Bullish |
| Timeframe | 1HR |
| Strategy | Pullback |
| Result | -1.01% |
| Verdict | Good Trade |
Before 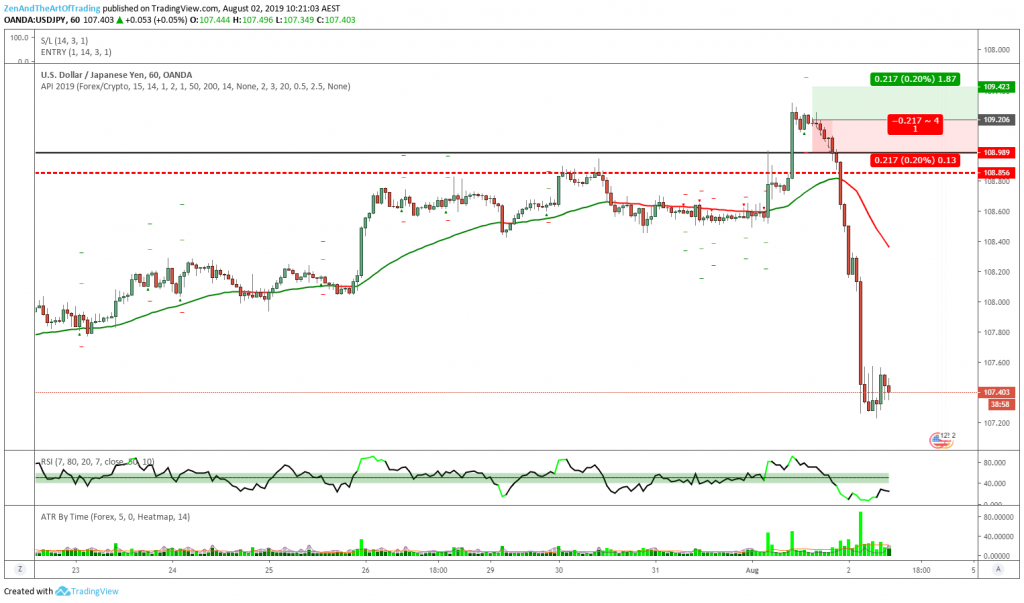
After
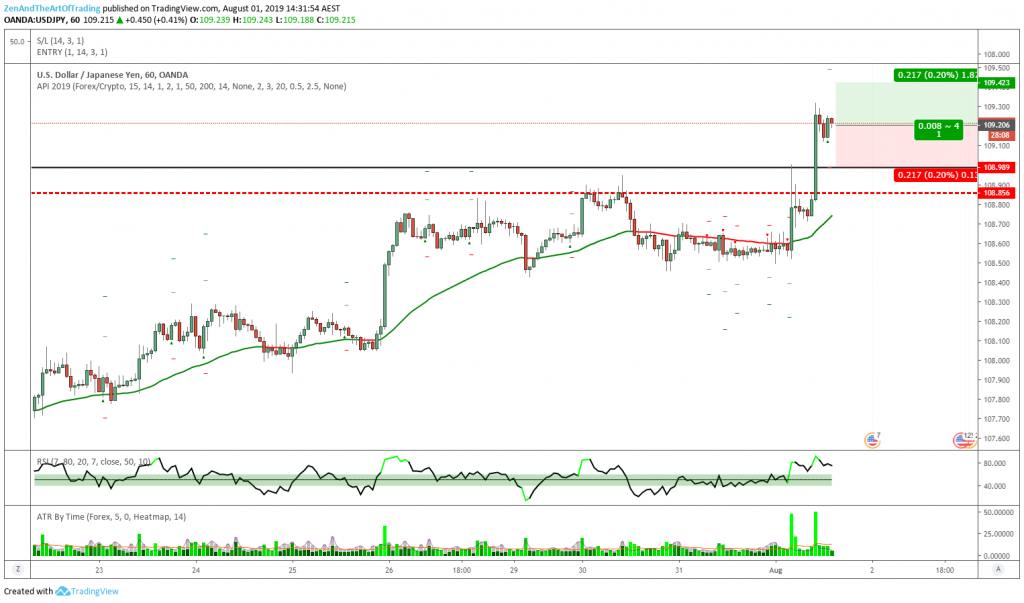
Reflection:
And this, my friends, is why we use stop losses.
Look at this Daily chart breakout pattern:
You rarely get a better-looking breakout setup than that. I had a lot of confidence in this breakout following through to the upside given the context of the markets.
Price had made a higher low, consolidated at the 50-EMA and previous resistance-in-trend, and then impulsively broke above and out of that range.
But then look what happened:
This is the biggest fake breakout trap I’ve seen this year. Price did not even pause on its way back down – it tore through support zones like a knife through hot butter.
Can you imagine if I hadn’t used a stop loss on this trade? In my very early days as a trader, there were times when I wouldn’t use a stop loss. And this situation is a great example of how that is the most dangerous risk you could play with as a trader.
I lost 1% on this trade. An almost meaningless number to me and to my trading account. However, if I had not used a stop loss on this trade then by the time I woke up the next day I would have been down -8%.
If I had frozen or refused to take the loss for whatever reason, then by that next night I would have been down -11%. Today, just 3 days later, if I were still in the position I’d be down -14%. And that’s with only 1% risk – in my early days, I traded much larger than that!
The moral of the story is… use a stop loss. It’s there for a very good reason.
Trade #150
| Market | EUR/JPY |
| Date & Time | 2/8/19 9:15 AM |
| Daily Trend | Bearish |
| Timeframe | 15M |
| Strategy | Pullback X |
| Result | +1.08% |
| Verdict | Good Trade |
Before 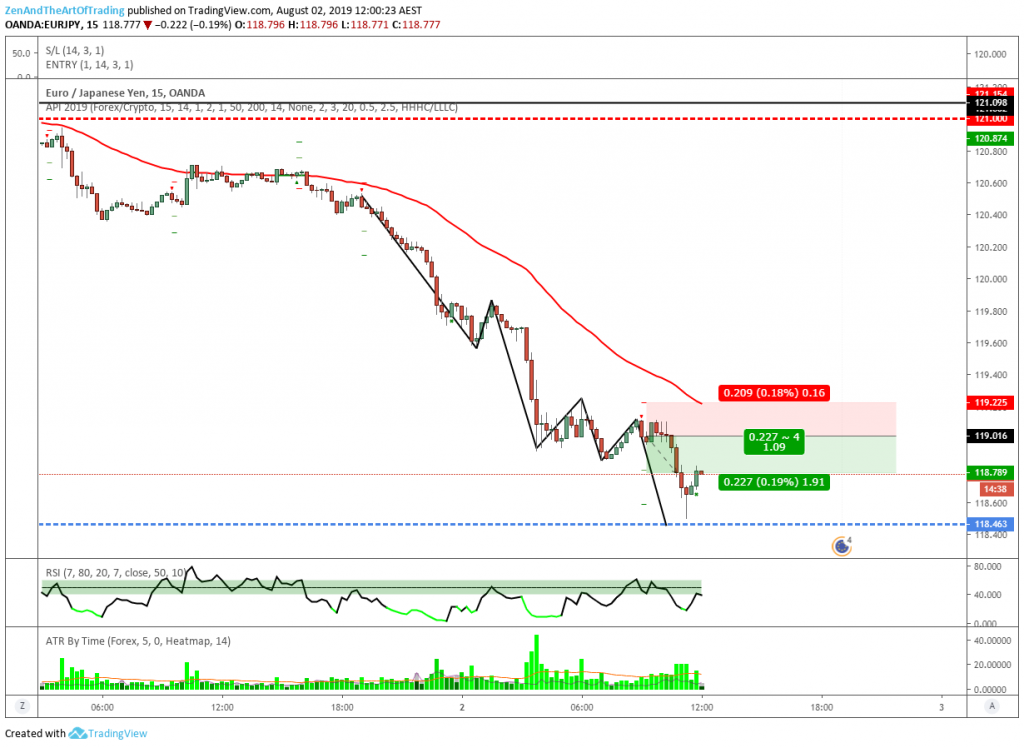
After
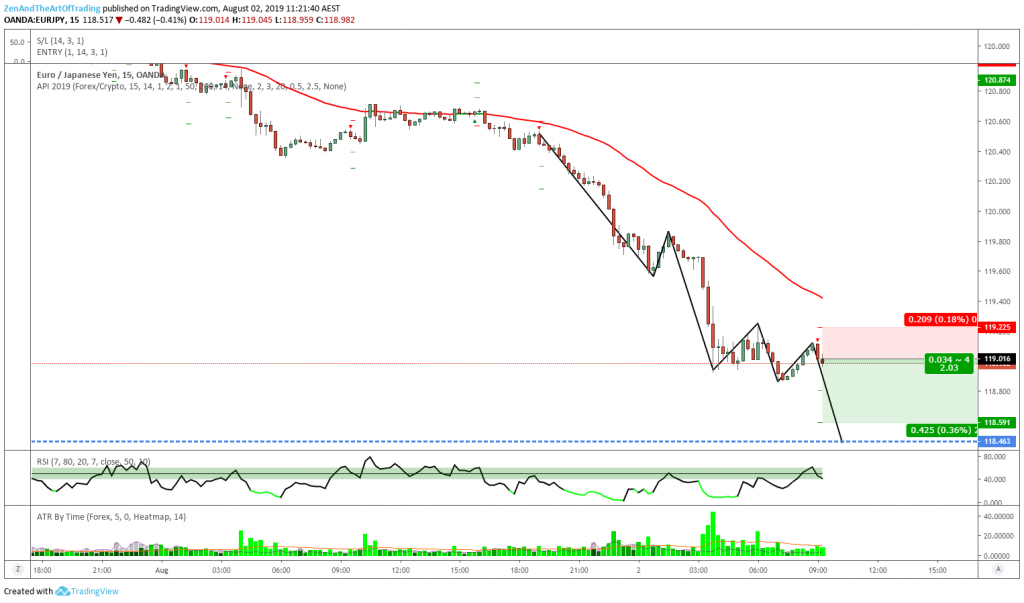
Reflection:
My second-last trade for the week was a nice quick intraday trade on EUR/JPY.
I took a trade on EUR/USD after this that is still playing out and has already hit my first profit target, but I will wait until the second position plays out before I address that trade in this journal as this journal post is long enough already.
Anyway this particular EUR/JPY trade was a very typical and simple pullback setup. Price was in a bearish trend on the higher timeframes (which is not a condition for my 15-Minute strategy but gave me more confidence in this trade).
And price was making lower lows and lower highs on the 15-Minute timeframe, below the 50-EMA and with a lot of momentum.
So when price made another lower-low and pulled back to give me a valid entry reason I went for the trade. Unfortunately price bounced off a Daily support zone which meant I had to exit the trade with a smaller profit than I’d hoped for.
But I followed my rules to the letter, so this was a Good Trade and a good trading week.
Weekly Reflection
Last Week’s Goal: Execute my plan flawlessly.
Overall Grade: A
As I said at the beginning of this post, this week wasn’t very exciting in terms of my equity performance. I followed my rules so I have nothing to regret regarding my decisions, but it still sucks to go through drawdowns that last this long and go this deep.
I’m far less stressed than I’ve ever been as a trader and my drawdown is hardly catastrophic and not nearly as bad as ones I’ve had in the past. So it’s important to keep my progress in perspective and have realistic expectations of myself.
It takes time to become a great trader, and I believe I am building the correct habits and foundations to get there in time. All that is left to do is walk the journey, and drawdowns are an inevitable part of it.
So I will try not to think about it too much and just focus on continuing to execute (and gradually improving) my trading plan. The rest is out of my control and I need to learn to surrender the obsession with feeling like I am in control.
All I am in control of is my trading plan and my trading decisions – not the markets. Process over outcome.
Monthly Review
Here is my equity curve after the month of July:
Annual Return: +12.03% | Drawdown: -12.88%
Here are my monthly stats for July:
And here is my drawdown graph for the year:

This month all my portfolio pairs entered a drawdown period at the same time, which is why I have had so many losing streaks. This is uncommon according to my backtesting, so I’m not really sure what to make of it yet.
GBP/USD was the only profitable pair for the month with an average 2.2R win.
There were no pairs that performed particularly bad so there is no need to review the pairs that I have in my portfolio. I guess all I can do is continue to trade them this month and compare this month’s data to last month’s data to see if there are any patterns developing.
I am currently in the worst drawdown period of the year, sitting at 12.88% with a max DD of 14.24%. Statistically speaking, this is approaching the average maximum drawdown for a 1,000 trade sample which is interesting.
What that means to me is that either I am trading my strategy incorrectly to how I backtested it (which I don’t believe I am), or that I have just experienced a natural but extreme drawdown and the worst of it is likely behind me (assuming that I continue to execute my plan consistently).
I do not hold this as an expectation – I am fully aware that backtesting historical data does not indicate accurate future performance and that my drawdown could easily exceed that number.
But statistically-speaking, it is likely that my strategy will begin to perform better over the rest of the year. And the only way to find out is to continue to execute it consistently, and so that is what I will do.
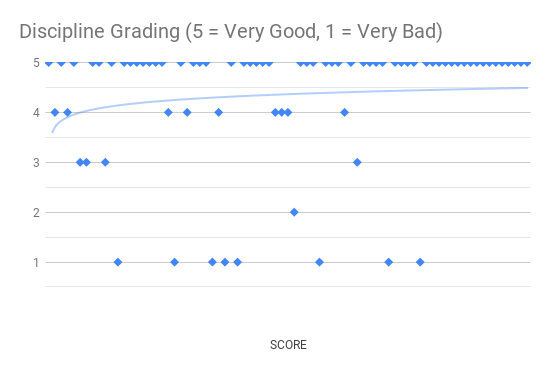
Discipline Review
This month was another flawless month in terms of discipline and trade execution. I made one minor error early one morning when entering a position, and I entered the incorrect stop loss price and had to close the position for a miniscule loss to the spread in order to rectify it.
But because I caught it immediately, I don’t count that as a major violation of my discipline or a major mistake so I didn’t include it in this month’s data.
This aspect is perhaps the most impressive part of my trading so far this year. Last year I broke my rules several dozen times. This year I’ve only broken my rules 8 times, most of those by accident, and the last time was over 2 months ago.
This is a great development and I am really glad to see that discipline is becoming a habit for me.

Conclusion
This month was rough, but I technically didn’t do anything wrong. That puts me in an interesting position as a trader.
It’s easy to waver in self-confidence during periods like this, especially as an inexperienced trader. Becoming consistently profitable is a process, and even once you get there, you still have a lot of work left to do. That is where I find myself now.
I am profitable for the year, but the past two months have been painful to endure. That’s the irony of being a trader – even when you’re making money, it’s still not enough to calm your emotions and nerves. There is always a lingering threat of a losing streak or a nasty drawdown right around the corner, which doesn’t give you any time to celebrate your winning periods.
And perhaps this is a good thing. As traders our job is to be as emotionally disciplined as possible so that we don’t make bad trading decisions. Exuberance can lead to bad trading decisions just the same as fear, so keeping both in check is extremely important.
Never rest on your laurels. Never let your guard down as a trader. Always put the plan and your long-term expectancy first and foremost, and do your best to regard your most recent trading performance with skepticism.
If you have been winning a lot lately, don’t expect it to continue forever. But this is simultaneously a message of hope – because if your winning can’t go on forever, then by implication, losing can’t go on forever, either.
That is how I am dealing with this period of drawdown. Eventually it will end – But I don’t know when, and I don’t know how it will play out. So all I can do is keep trading my plan and have faith that eventually my long-term edge will bring me out on top again.
It’s not the first drawdown I’ve traded out of, and it certainly won’t be the last. Good luck with your own trading, and I hope some of this reflection helps you in your own journey.
Next Week’s Goal
Execute my plan flawlessly.
Previous Week’s Review
This Week’s Review
Myfxbook Stats

