October 2019 Review
Table of Contents
Forex Trading Review – Week 44
Hi traders! Hope your trading week went well.
It’s that time again, and I’m going to review my trading performance for the month of October. I will analyze my strategy statistics as well as my self-discipline and general trading psychology so far this year.
28th October – 1st November
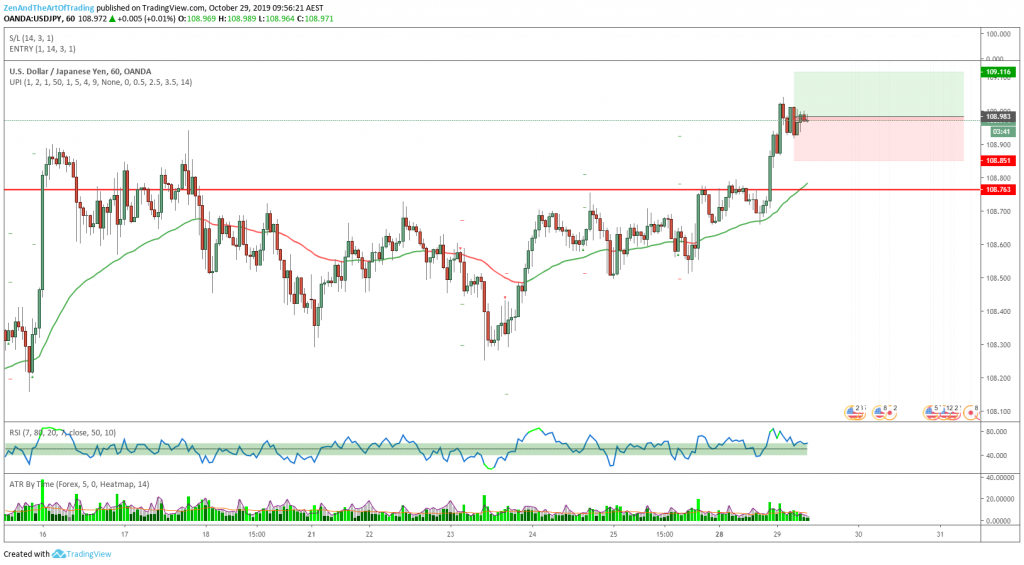
Trade #219
| Market | USD/JPY |
| Date & Time | 29/10/19 5:00 AM |
| Daily Cond. | Bullish Breakout |
| Timeframe | 1HR |
| Strategy | Pullback |
| Result | -1.00% |
| Verdict | Good Trade |
Before 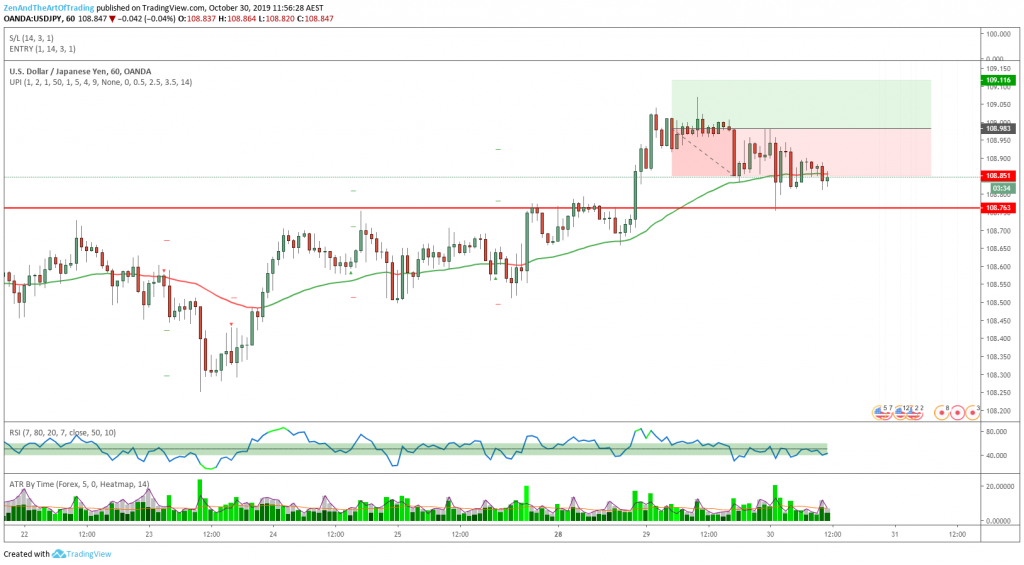
After
Reflection:
This was my first trade for the week. USD/JPY had just broken to new highs on the Daily chart and I was anticipating a high likelihood of trend-continuation to the upside.
Unfortunately price retraced lower to retest structure and the 50-hour EMA, stopping me out for a loss on this trade. Good Trade nonethetheless, I’d take this setup 1000 times out of 1000 because it has a great win rate (usually).
You’ll have to take my word for it, because I know… the past 4 months I’ve been struggling to win anything lol. But according to my backtesting, this pattern performs great on historical data, which means that theoretically, unless the USD/JPY’s major market participants have suddenly changed their behaviors overnight, it should continue to perform well into the foreseeable future.
One day soon I’ll break this curse of losing streaks and prove it!
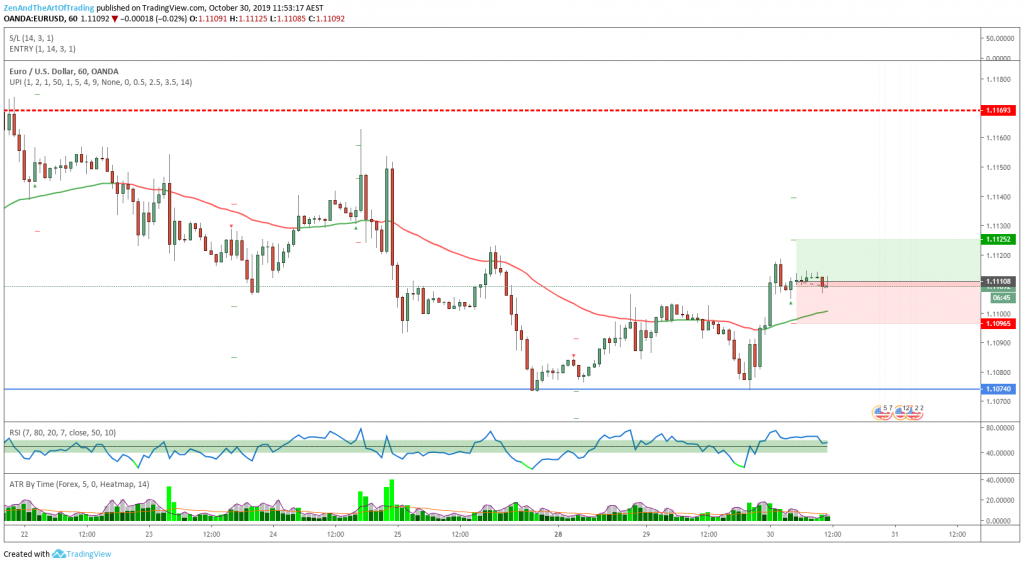
Trade #220
| Market | EUR/USD |
| Date & Time | 30/10/19 9:00 AM |
| Daily Trend | Potential Reversal |
| Timeframe | 1HR |
| Strategy | Pullback |
| Result | +0.52% |
| Verdict | Good Trade |
Before 
After
Reflection:
This was a great momentum reversal trade. The daily chart had just tested (and responded from) a key Daily structure level, which lead me to believe that we might see a further pop out of this market.
Indeed we did, but of course I was stopped out for break-even on my second position before the market cooperated with my analysis. This was a good thing though, because if I hadn’t had my stop at break-even then this trade would have been wicked out for a loss.
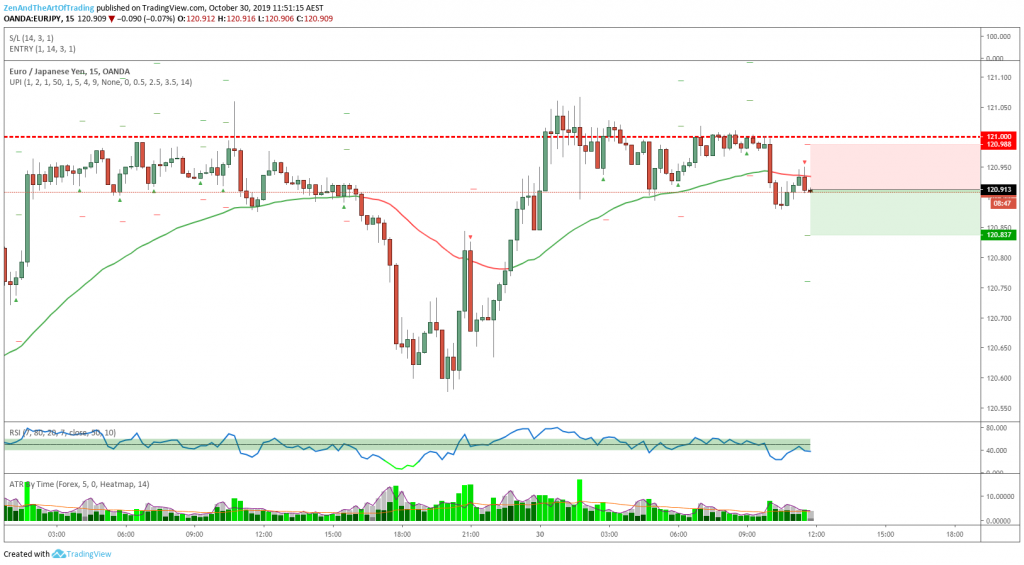
Trade #221
| Market | EUR/JPY |
| Date & Time | 30/10/19 11:45 AM |
| Daily Trend | Bullish (At Resistance) |
| Timeframe | 15M |
| Strategy | Pullback |
| Result | -1.00% |
| Verdict | Good Trade |
Before 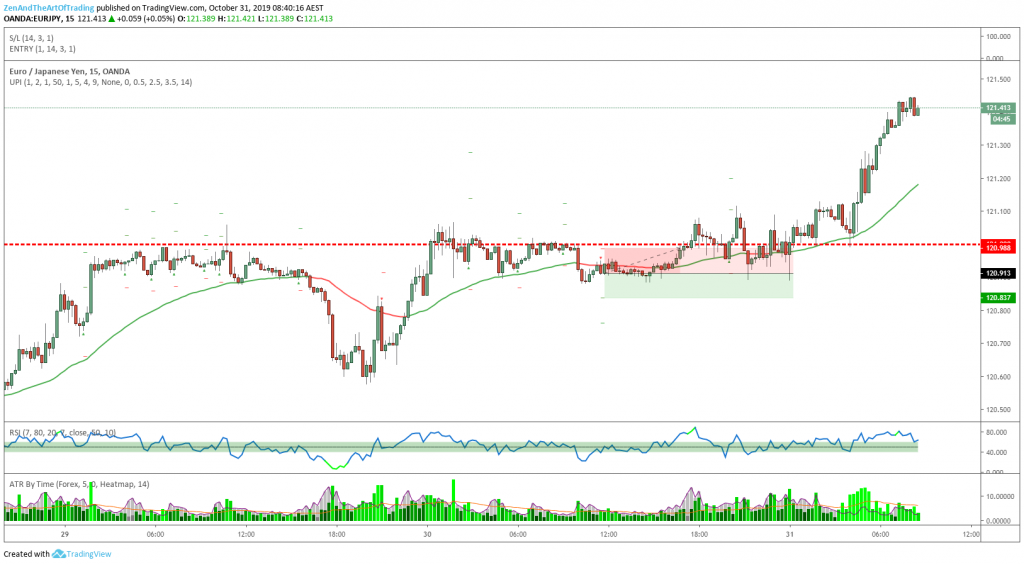
After
Reflection:
This was somewhat of an anti-correlated trade to the previous EUR/USD trade I was involved with at the time. EUR/USD had just bounced off a major support level, and EUR/JPY had been consolidating against a major resistance level.
This gave me an opportunity to go long on EUR/USD and short on EUR/JPY.
It is worth mentioning that throughout my testing and live trading over the past few years, I have begun noticing that when price rejects from a key level and then immediately comes back to consolidate at that level, we typically see a breakout occur soon after.
I like to call this situation the “build-up, break-out” trade, because you can literally see price build up tension and energy right below the key level, coiling itself for a powerful move through it. I haven’t properly tested this theory to prove whether or not it has an edge, but it is something I have been paying attention to and I suspect that there is potential for a profitable strategy there.
Also, I think it could make for a good negative filter. If build-up break-out trades often breakout in the direction of the underlying trend, then it would be unwise to try to trade reversals during such a situation. But of course I need to prove this theory before I can act on it, so it’s just a theory for now.
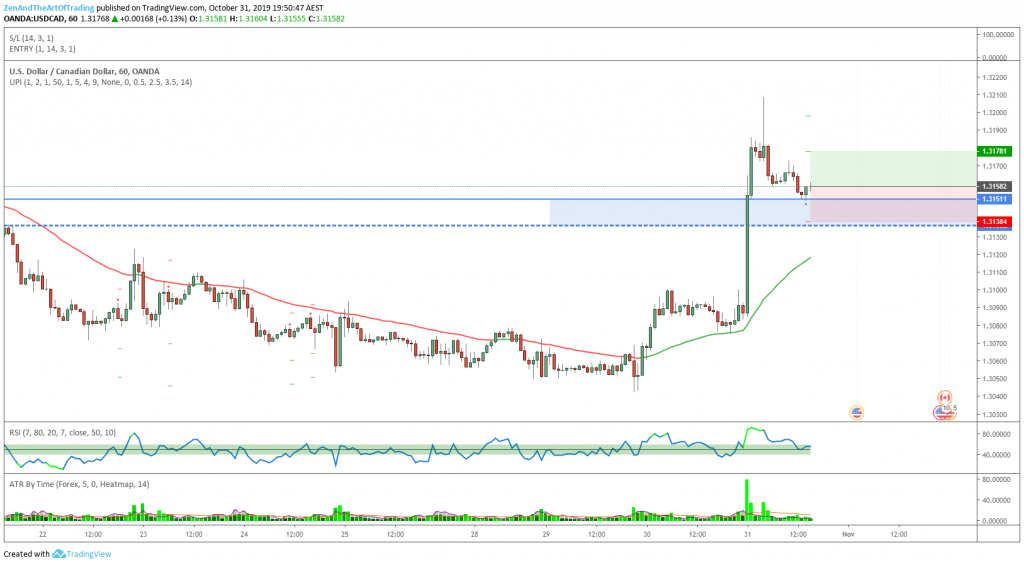
Trade #222
| Market | USD/CAD |
| Date & Time | 31/10/19 3:00 PM |
| Daily Trend | Bearish (Testing 3XOTZ) |
| Timeframe | 1HR |
| Strategy | Pullback |
| Result | +0.52% |
| Verdict | Good Trade |
Before 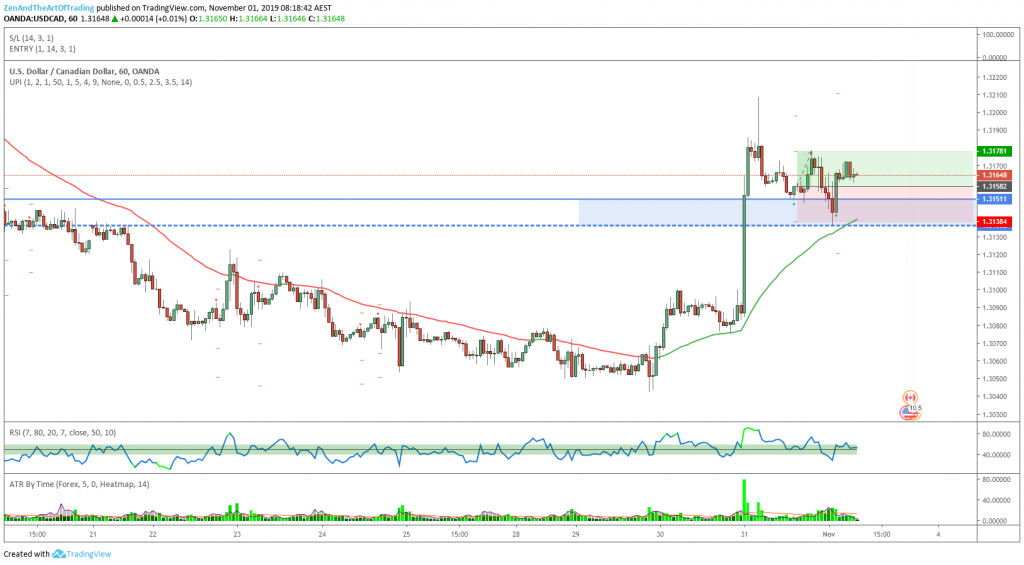
After
Reflection:
This was a fantastic trading opportunity on this timeframe. Price had just responded from a fundamental news release which sent USD/CAD flying above the 50-hour EMA and a major Daily resistance zone.
Price reacted off the 50-Day EMA which caused a significant retracement back down towards the 50-Hour EMA. This is where I was waiting for a trend-continuation opportunity, and we actually got a valid setup right within that zone of “most likely” support (what we EAP students call a 3X-Tested Optimal Trade Zone).
Trades like this are the easiest to take, because you really don’t care if they lose. First of all, no matter how good a trading opportunity is, it can always potentially lose, so it’s important that we manage our risk accordingly and never risk more than we’re prepared to lose on any single given loss.
But once you do that…. when you’re confronted with a trading opportunity as solid as this one, you literally jump at the chance. Because if the trade wins, then you got to capitalize on the high-probability opportunity and you feel great.
But if it doesn’t win, then you take a small paper cut and move on to the next opportunity – but you still feel good about having the courage to take a shot at such a high-probability setup, knowing and fully believing that if you consistently take these types of setups you’ll come out ahead in the end.
That’s what great trading is all about!
Trade #223
| Market | EUR/JPY |
| Date & Time | 1/11/19 10:30 AM |
| Daily Trend | Bullish (Testing Resistance) |
| Timeframe | 15M |
| Strategy | Pullback X |
| Result | -1.01% |
| Verdict | Good Trade |
Before 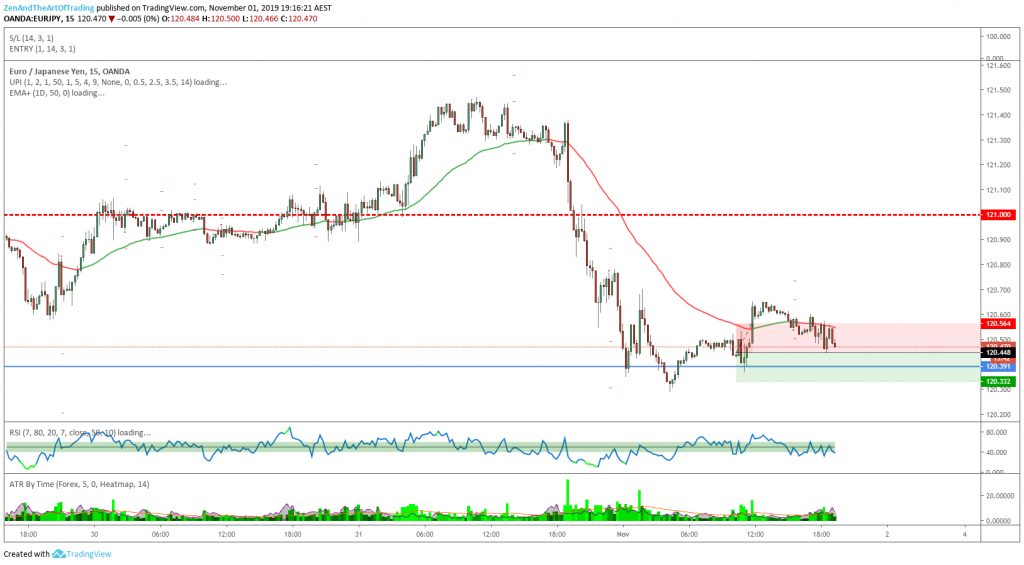
After
Reflection:
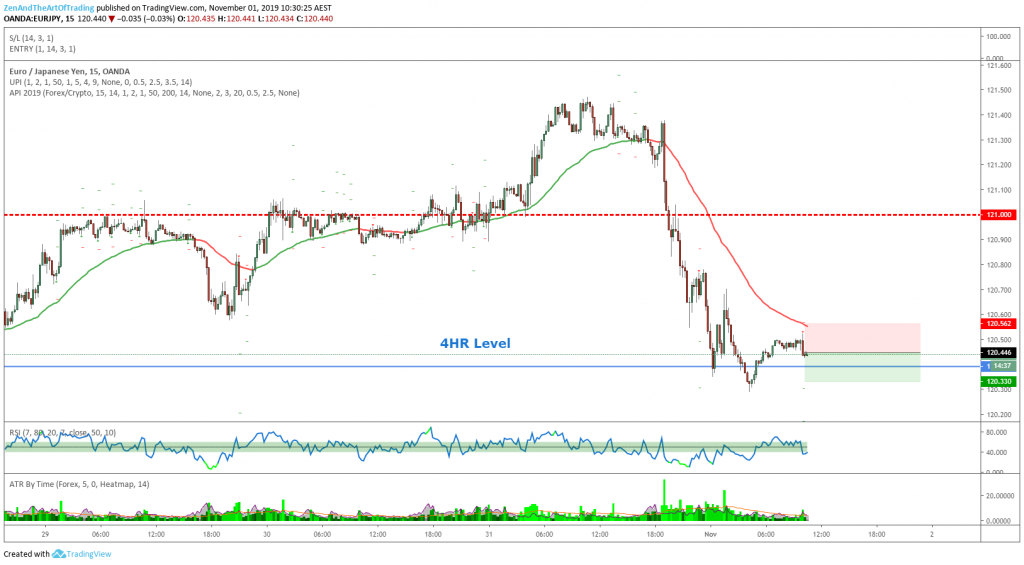
This was an interesting loss. On this timeframe, according to my trading plan rules, this was a perfectly valid trading opportunity.
But if you zoom out a little bit to the higher timeframes you see a completely different picture. Looking at the price action patterns on these charts does NOT make me feel comfortable going short:


First of all, the blue line that price broke and closed below on the 15-Minute chart is a major 4HR support level within very bullish consolidation (the “build-up break-out” scenario I mentioned previously).
On the 15-Minute chart it appears that this level has been breached, but on the 1-Hour chart it is clearly acting as support with a swing-low RSI Swing Signal occurring right at that level, and the 4-Hour chart has closed as an obvious hammer candle right on that level.
Does this look like a place you would want to go short? Because it doesn’t look like a place I would want to go short, but I did anyway, because my rules told me to.
On the one hand, obviously this is great and I am exercising extreme discipline to my trading plan. On the other hand, this is terrible – because my trading plan is making me do silly things like go short against a major 4HR support zone that has given clues that it’s going to continue acting as support.
These are exactly the types of things I’m currently in the process of adapting my trading plan for so that I can have more confidence in my trading process.
Trade #224
| Market | AUD/USD |
| Date & Time | 1/11/19 3:00 PM |
| Daily Trend | Bullish (Testing PR) |
| Timeframe | 4HR |
| Strategy | Pullback |
| Result | N/A |
| Verdict | Good Trade |
Trade 224
Reflection:
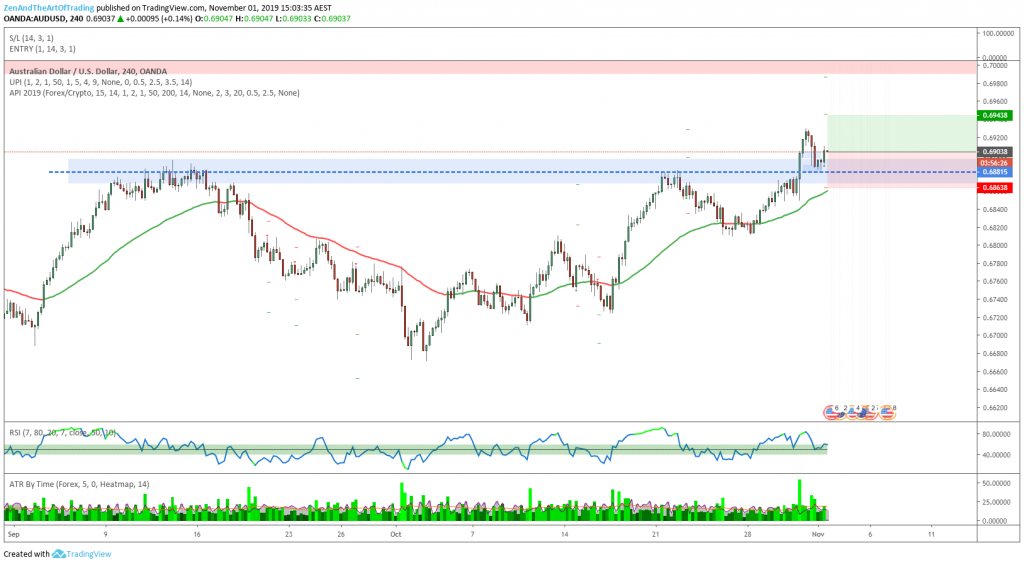
This is a fantastic 4HR trend-continuation opportunity for this currency pair (AUD/USD).
There is a lot of fundamental news happening both this last week and in the week to come regarding interest rates, economic health factors (such as non-farm payrolls) and monetary policy decisions. During these times we can expect to see some pretty impressive moves out of some currencies as the fundamentals shift.
I’m positioning myself on AUD/USD to capture any potential moves out of the coming week of economic data. USD is suffering after last week’s payroll data, and we have an AUD interest rate decision on Tuesday. I have no idea what the Australian central banks are going to do, but I know a good risk:reward profile when I see one, so I’m involved in this trade well ahead of time.
I don’t normally trade the 4-Hour chart simply because I have plenty of time to trade the 1-Hour and 15-Minute charts and so the 4-Hour chart is a little bit too slow for my liking.
But I’m trying to expand my playbook and the amount of opportunities I can exploit, and I’ve backtested this pair and found it profitable on this timeframe using this strategy, and so given the fact that this setup is such a rare alignment of technical and fundamental factors, I decided to take a 1% risk chance on this trade.
Technically speaking I have not adjusted my trading plan yet to add 4HR trading to my system, but knowing that the pullback strategy is more effective on the higher timeframes I feel perfectly comfortable using a little bit of discretion to get involved with this trade.
And as I said earlier – the risk:reward profile on this setup (if it happens to play out how I expect it to) is more than acceptable, so if I lose another -1% on this trade I won’t be happy about it but it certainly won’t hurt me too much!
Trade #225
| Market | USD/CAD |
| Date & Time | 1/11/19 7:00 PM |
| Daily Trend | Bearish (Testing 3XOTZ) |
| Timeframe | 1HR |
| Strategy | Pullback |
| Result | +0.52% |
| Verdict | Good Trade |
Before 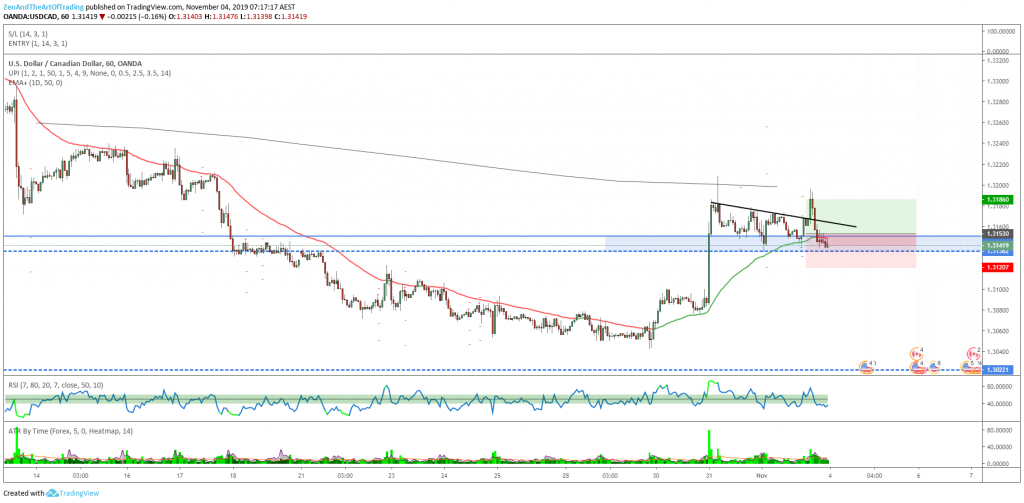
After
Reflection:
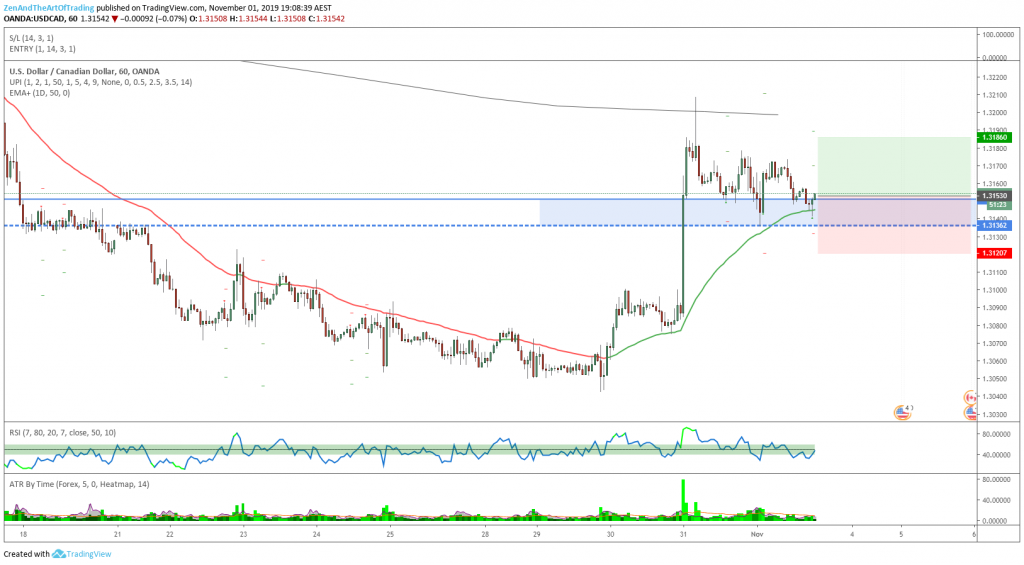
This was basically a second reattempt at getting involved with this reaction off the 3X OTZ area near the 50-Hour EMA (the blue zone).
Price retraced to stop me out for break-even on my initial trade, but then it pulled back to print a much larger bullish engulfing candle. This caught my eye, but did not technically meet my rules for a re-entry, so I waited a little longer.
Then I saw price touch the 50-EMA and put in yet another swing-low engulfing candle pattern. So I placed my stops according to the most recent swing-low and managed to capture one more swing out of this support zone.
This second swing was much closer to the magnitude that I initially expected out of this zone, so when price retraced to stop me out for break-even on my second position for a second time I stopped looking for any more trading opportunities out of this zone.
Weekly Reflection
Last Week’s Goal: Backtest At Least 2 Hours Per Day.
Overall Grade: B
This week was another average one. Nothing exciting, nothing too damaging, just another slow bleed into drawdown.
My drawdown has not gotten much worse over the past 2 months, I’ve been mostly trading sideways for the most part (as opposed to June and August where I couldn’t seem to win a trade to save my life).
I’m obviously a little stressed out, but only because I’m not quite where I wanted to be within the timeframe I wanted to be there. I haven’t lost much money (other than all my profits for the year), so financially I’m not under pressure because of this slump in my trading results, which is very important to mention.
If I were financially stressed right now I imagine that I’d be making far more frequent mistakes and trading psychology errors. But because I managed my trading capital and risk-per-trade appropriately to my personal risk tolerance, this period of my trading is really just a frustrating setback and not a total emotional and financial disaster.
So at least I’m doing something right with my trading!
Monthly Review
Annual Return: -1.09% | Drawdown: -23.08%

Overall, this month has been yet another slap in the face from the markets, ending with a -5% loss. It seems that my strategy just can’t catch a break these past 4 months.
As I’ve mentioned several times in this journal, I am now deep into the process of reviewing, testing and analyzing my trading rules to improve my positive expectancy while reducing my average and max drawdown. If you’ve ever been through this process yourself then you know how grueling and time-consuming it is and I have no idea how much longer it will take to complete the process.
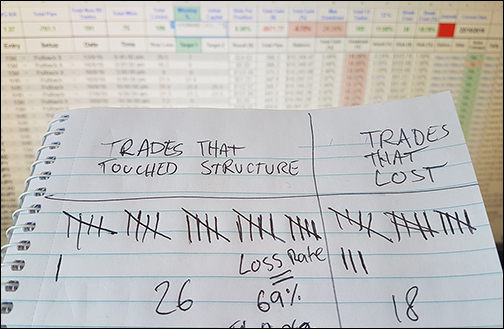
But so far I have discovered three extremely important patterns in my trading:
- Trend-continuation and momentum trades that occur immediately following a test of major daily resistance have a 70% losing rate (that’s pretty fucking bad!)
- Trend-continuation and momentum trades that occur immediately following an RSI Swing Signal setup have a 60% losing rate (not as horrible as structure reactions, but still a negative edge!
- 15-Minute trades that occur around major 4HR or Daily levels appear to have a bad win rate (still need to confirm just how bad through testing and post-trade analysis)
I’ve also noticed that RSI divergence occurs a lot preceding my losing trades, so that is something I’m looking into to see if ignoring setups that occur after RSI divergence will increase my win rate (or more importantly in my case, reduce my max drawdown).
I also acknowledge the fact that I’m only trading one strategy right now, and that if I were to add more strategies (with edge) for attacking different market conditions then I could potentially reduce my max drawdown that way, too.
For example – the past 4 months my trend-continuation and momentum trading strategies have performed worse than they ever have. But if I had been also trading Advanced Patterns or some kind of counter-trend or consolidation ranging strategy, then maybe those styles of trading would have been performing great these past 4 months and might have either made up for or reduce the amount of losing trades I suffered through.
So in addition to analyzing my past trades and improving my existing trading plan, I am also backtesting entirely new strategies and ideas to see if they are compatible with my current strategies. I would love to add Advanced Patterns and/or counter-trend structure setups to my trading plan, but as always, I need to backtest everything first – and that’s going to take me the rest of the year (if not longer) to do.
So until next time…. you know where I’ll be!
Discipline Review
My trading discipline this month was technically flawless. I did not break my rules on purpose a single time, and any trading process mistakes I made were not significant enough to negatively impact my trading results.
I think this is because I have been far more selective with my trades this month. I haven’t taken any trades that I didn’t feel met my trading rules 100%.
That being said, as I mentioned earlier in this journal entry – I’m still not 100% comfortable with my trading plan even though I’m being very disciplined and consistent to it. I just don’t like how it ignores higher timeframe situations and gets me into trading opportunities that clearly have a lower probability of winning.
As you can see, out of 22 trades this month I only had a 22% win rate. This is just not good enough for me, and I need to find a way to improve that win rate and reduce my average drawdown and especially the length of drawdown.
Of course this is all easier said than done and there’s only one way to do it – and that’s through hours and hours of hard work testing and proving that the changes I want to make definitely improve my expectancy. And so that’s what I’ll be doing for the rest of the year – testing, analyzing, and systematically improving everything I can about my trading process.
Good luck with your own trading, and I hope you find these musings valuable to your own process. If I help another trader to learn anything of value out of these experiences then that alone will make all the extra struggle of documenting this journey worthwhile!
Trade green!
– Matt.
Next Week’s Goal
Execute my plan flawlessly.
Previous Week’s Review
This Week’s Review
Myfxbook Stats

