September 2019 Review
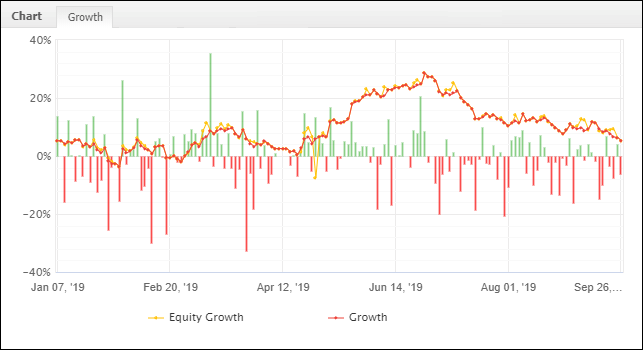
Table of Contents
Forex Trading Review – Week 39
Ouch!
The markets have been slapping me around these past 3 months. Since June I’m down 18% and I lost all 4 trades I took this week.
This drawdown is admittedly becoming a little bit stressful. Not because I don’t think I’ll be able to make the money back over time, because I know I can – but because I have no idea how much longer this will go on for.
This is a particularly rough drawdown. But drawdowns themselves are not unusual. In fact they’re extremely common, and so they must be accepted and managed accordingly.
So despite the mild pain and frustration and stress, I am genuinely excited to be able to demonstrate to my readers what it’s like to endure and eventually survive a significant drawdown while staying focused on the long-term process instead of my emotional responses – which I can tell you are not exactly positive right now!
23rd September – 27th September
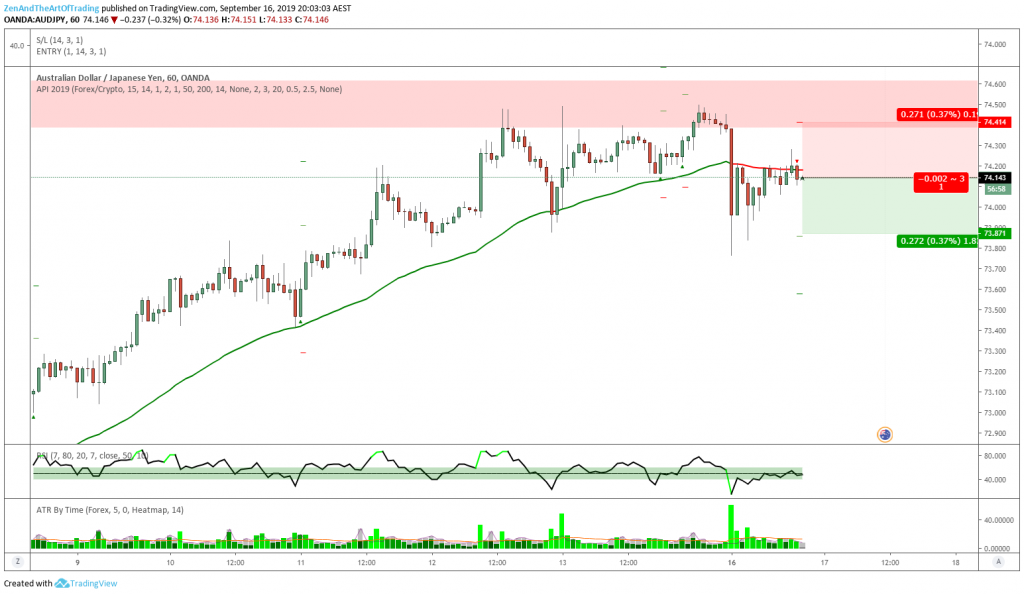
Trade #191
| Market | AUD/JPY |
| Date & Time | 16/9/19 8:00 PM |
| Daily Cond. | Testing Resistance |
| Timeframe | 1HR |
| Strategy | Pullback |
| Result | +2.45% |
| Verdict | Good Trade |
Before 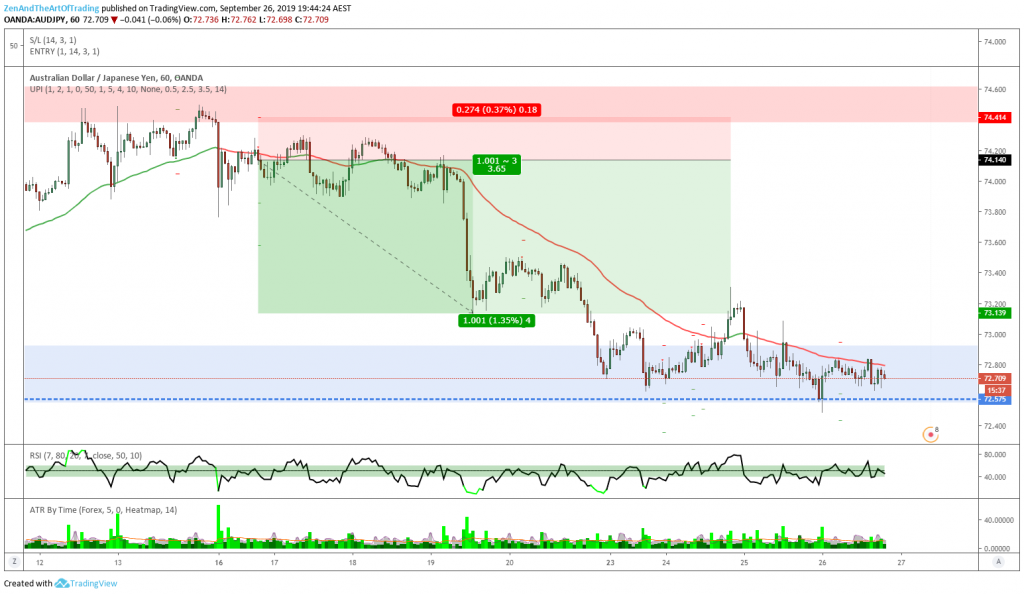
After
Reflection:
This was a solid trade on AUD/JPY. If you remember from last week, I caught a huge bullish winner as price broke out of a Daily resistance zone:

Then price rallied up into a Daily resistance zone (the red box):
Looking at that chart, it’s pretty obvious that price is preparing for a retracement. Obviously we don’t know that for certain, but look at that price action: we have 9 bullish days in a row with shrinking momentum heading right into previous support which should turn to resistance.
This is a high-probability counter-trend trading zone and opportunity. In fact we even got a classic counter-trend bearish swing-high engulfing candle right in that zone on the 4HR chart, which is the exact entry reason my trading mentor uses to trade counter-trend markets in zones like this.
But because I don’t trade the 4HR chart yet (I prefer intraday trading for now while I have the time) I did not take that short opportunity. Instead I waited for price to give me a reversal sign on the 1HR chart, which is what we got here.
I road the trade down to previous support (the blue line) where I expect price to have a bullish reaction:
I was waiting for a double-bottom or a 4HR engulfing candle in this blue zone to give me an objective reason to exit my short trade. But before that happened some kind of news event or data release caused AUD/JPY to spike up and tag my trailing stop.
Still a solid winning trade. I followed my rules and caught 2 large moves on the way up and on the way down out of this market, so I’m at peace with that outcome and pretty happy with this trade.
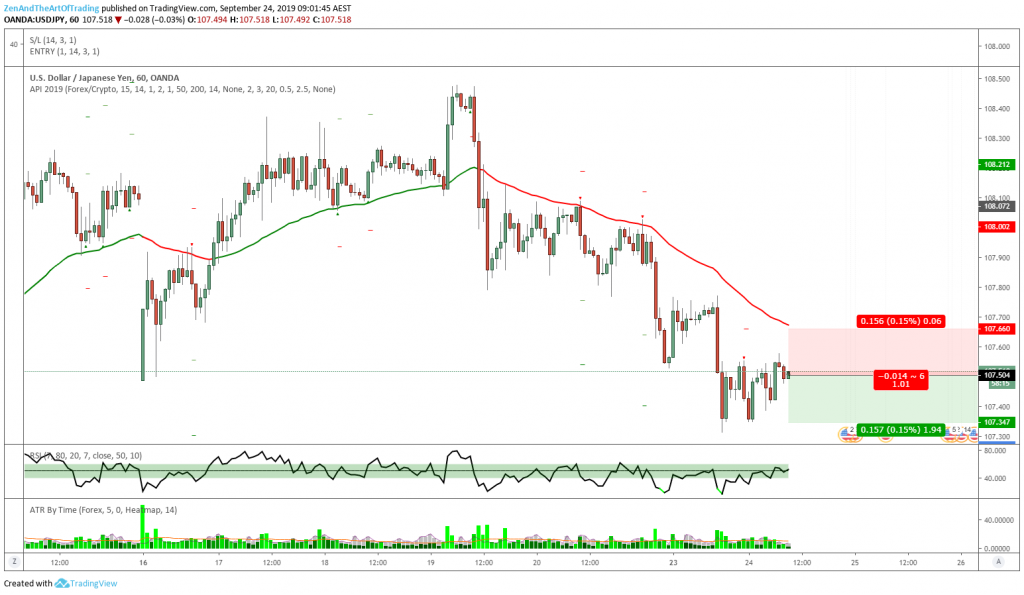
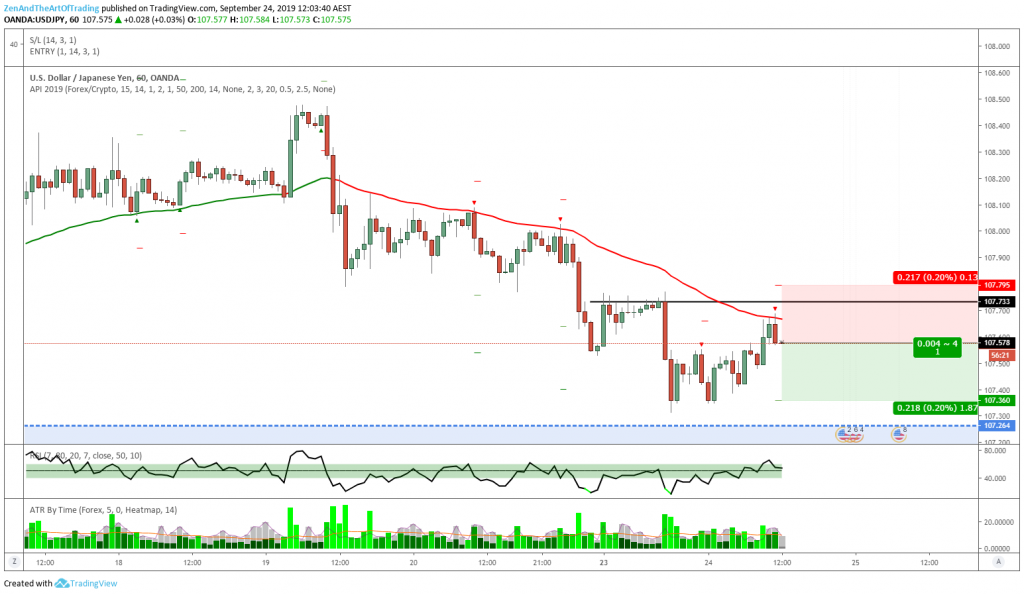
Trade #196
| Market | USD/JPY |
| Date & Time | 24/9/19 9:00 AM |
| Daily Trend | Consolidation |
| Timeframe | 1HR |
| Strategy | Pullback |
| Result | -1.02% |
| Verdict | Good Trade |
Before 
After
Reflection:
This trade met my rules, but I entered it late because I was asleep when the setup occurred.
Of course it immediately stopped me out after placing the trade. If I’d slept in an extra 15 minutes I might have avoided this losing trade – but in the past, sleeping in an extra 15 minutes has also cost me winning trades, so I try not to do that.
Not much could be done here except that perhaps I should analyze my backtesting results to see if it’s worth ignoring trades that I miss overnight. When it comes to intraday trading, if a position has not hit the first target within a full U.S. trading session then I feel it’s likely that the trade isn’t going to play out profitably.
There is also a double-bottom that occurred before this setup which may be a negative filter I ought to watch out for.
But I need to prove this with back-testing and/or forward-testing and analyzing my journal results before I make changes to my trading plan based on a hunch.
Trade #197
| Market | USD/JPY |
| Date & Time | 24/9/19 12:00 PM |
| Daily Trend | Consolidation |
| Timeframe | 1HR |
| Strategy | Pullback |
| Result | -1.00% |
| Verdict | Good Trade |
Before 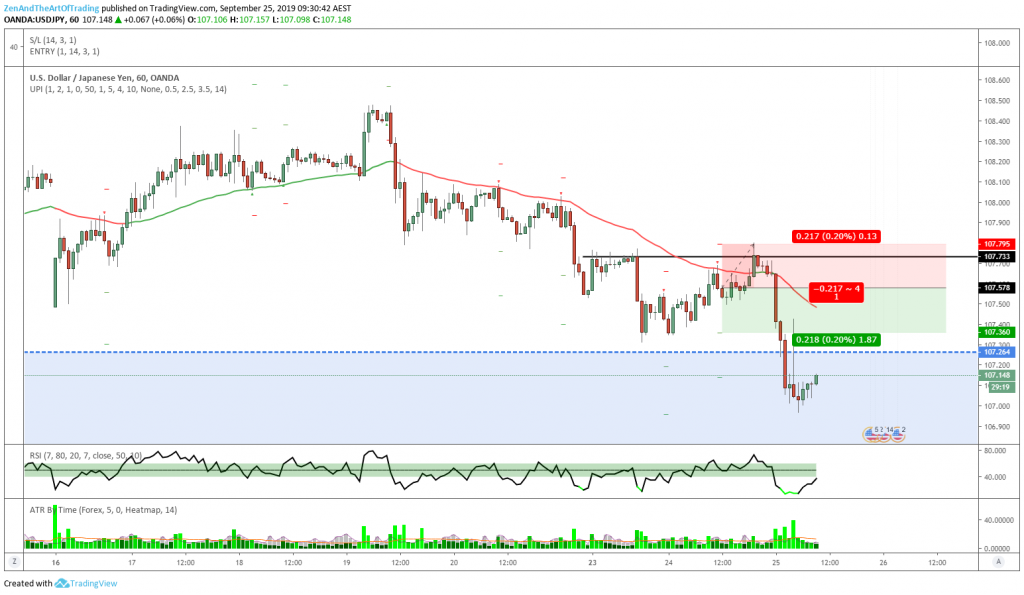
After
Reflection:
These trades are always fun. After taking a loss on the previous pullback setup, I got a second valid entry reason with a rejection off the 50-EMA.
I liked the look of this setup a lot more than the previous setup as the R:R profile, structure and EMA were all aligned to give me a high-probability opportunity.
But of course it doesn’t always play out according to plan, and this second attempt at capturing a deeper bearish retracement on USD/JPY was stopped out by a few pips before rolling over.
These kinds of trades are like rubbing salt in the wound during a drawdown. It’s trades like this that can make you become unhinged and emotional and make stupid decisions such as revenge trading, over-trading or risking big to make up for being robbed by the markets like that.
The best way to handle these situations is to completely ignore those thoughts. Feel them, accept them, then move on. It’s not personal, after all!
Those feelings you experience are just your projections, and they’re a feature of your ancient and primitive self-defense mechanisms. They serve a purpose. When you are robbed by something or someone, you should feel angry!
But it’s important to remember that the market doesn’t want to make you feel frustrated or upset, because the market is not a sentient entity. It didn’t rob you. It just didn’t do what you expected.
The markets are a phenomenon of constant indiscriminate flux and change – like much of life, it goes on with or without you, and it treats everyone the same with no special exceptions. And so if you understand this then it’s completely within your power to overcome those negative emotions and override those self-sabotaging actions with wiser thoughts.
Stay focused on the long-term outcome. This kind of thing will happen – a lot. And it happens to everyone, even “elite” traders. So the faster we can get used to it and accept it as part of the reality of being traders, the faster we will reach the state of mind required to trade in the “zone“.
I say this to you as much as I say it to myself to remind me of what I need to focus on instead of moaning about “what the market has done to me”. Whatever I do, I do to myself!
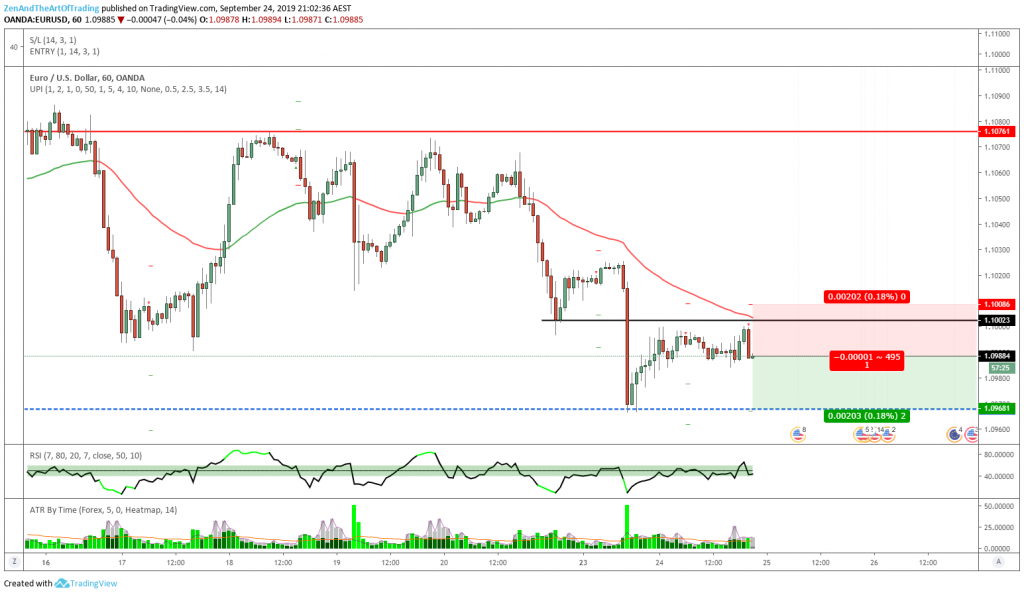
Trade #198
| Market | EUR/USD |
| Date & Time | 24/9/19 9:00 PM |
| Daily Trend | Bearish Consolidation |
| Timeframe | 1HR |
| Strategy | Pullback |
| Result | -1.00% |
| Verdict | Good Trade |
Before 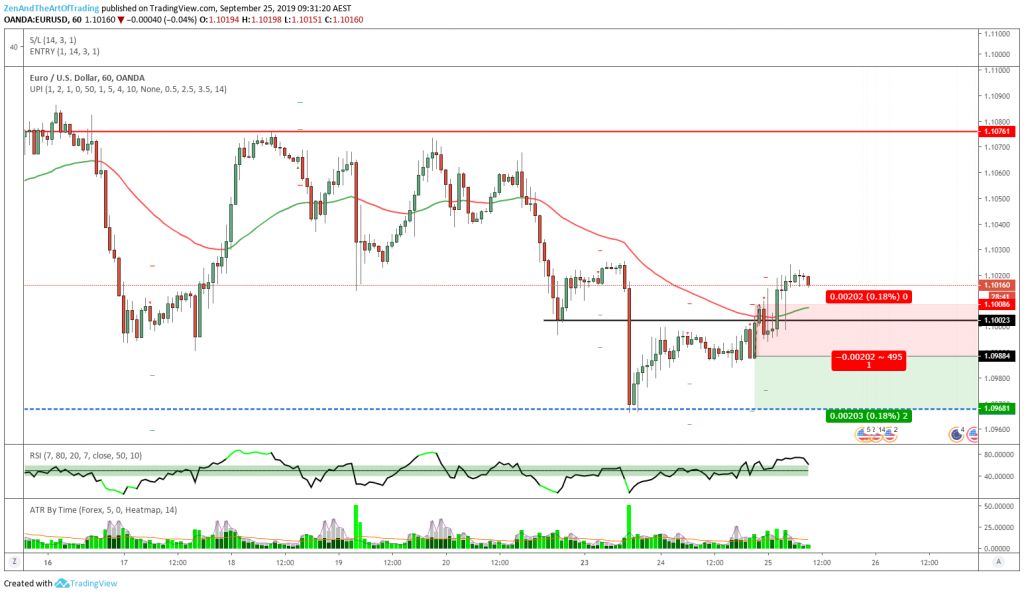
After
Reflection:
This was an interesting case of where a higher-timeframe filter would have saved me from a losing trade.
Price had already tested and bounced off the Daily support zone (the blue line) before I entered this short trade. During my backtesting I completely ignored Daily levels and my strategy still performed very well, which is why I’ve been ignoring them in my live trading too.
But as I get more experienced at reading price action and identifying these levels, I am becoming more confident in my ability to identify “danger” zones such as this where it seems my strategy has a higher chance of losing than winning.
When I placed this trade I really didn’t like the look of it, but I had to place it because it met my trading plan rules. I don’t like being in a situation like that. I prefer my trading plan to be in line with my personal trading philosophy whenever possible.
So this week I’m going to go through all 200 trades that I’ve taken this year and determine the win/loss % of trades that are taken after a test of a daily structure zone. 200 trades plus a little bit of backtesting should be enough to definitively resolve this issue once and for all.
Trade #199
| Market | USD/JPY |
| Date & Time | 26/9/19 7:30 PM |
| Daily Trend | Consolidation |
| Timeframe | 1HR |
| Strategy | Pullback |
| Result | -1.00% |
| Verdict | Good Trade |
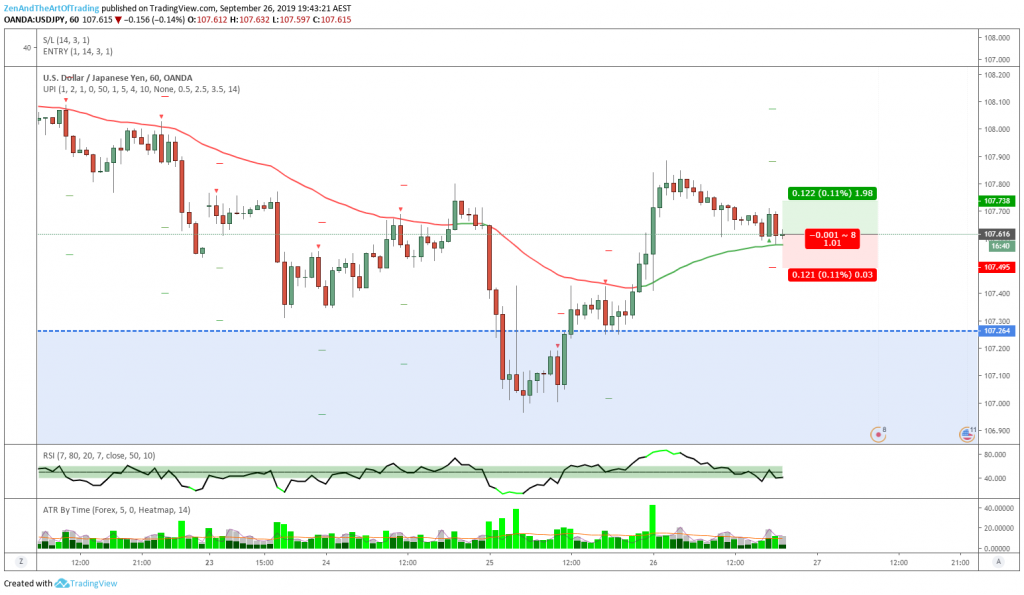
Before 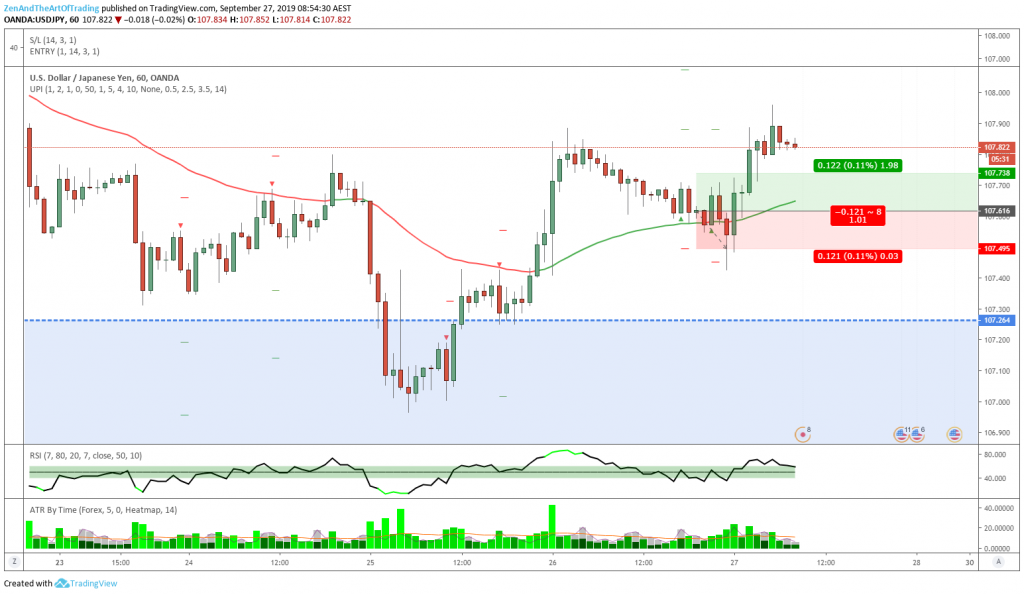
After
Reflection:
This was another painful trade to end the week on.
After giving a strong bullish reaction out of a key Daily support zone I figured that this market might reverse trend on this timeframe. So when price impulsively broke above the 50-EMA and gave me a valid pullback entry reason I went for it.
Then, like the previous USD/JPY trade, price spiked out my stop loss before continuing in the direction I expected it to. Good Trade, unfortunate outcome.
I’m not sure if increasing my stop loss distance would help these situations as it would also move my profit targets further away which might neutralize any effect it has on my trading results, but it’s something I’m considering testing when I get the time.
Weekly Reflection
Last Week’s Goal: Execute my plan flawlessly.
Overall Grade: B
This week was another rough one. I only took 4 trades which is a little below average, but all of them lost which is unusual and pretty sucky.
Not the best end to the month, but a -3.28% month also isn’t the end of the world. I’ll live to trade another day, and that’s the number 1 rule!
I gave myself a B for this week because I was a little more disorganized and distracted than usual with my trading process. For example, there were two days where I failed to do my top-down analysis in the morning.
I don’t think that this negatively impacted my trading results as I believe I would have taken all of these trades regardless as my top-down analysis had not changed since the day before, but it’s not a habit I want to get into. I need to make sure I’m being vigilant and consistent with my trading process at all times!
Monthly Review
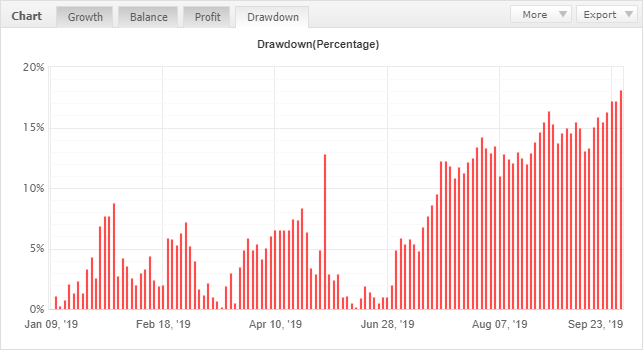
Annual Return: +5.37% | Drawdown: -18.06%
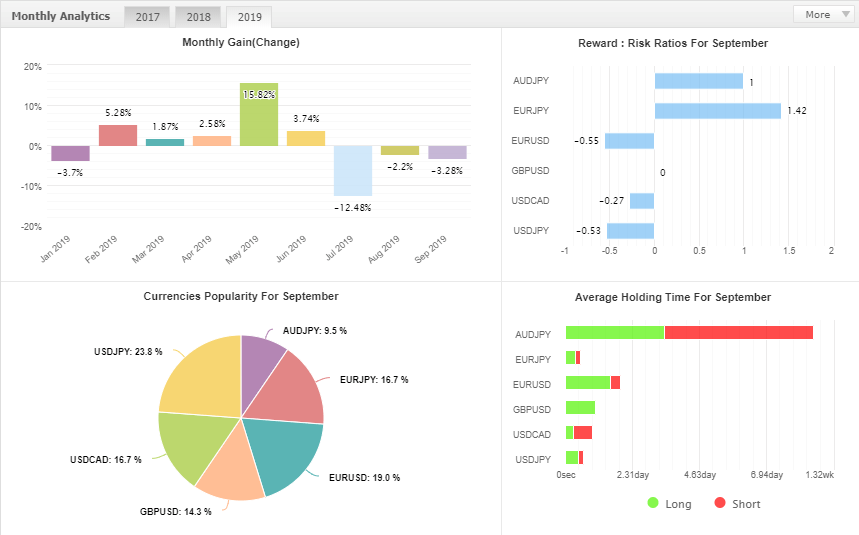
This month was terrible for my win rate, but not so bad for my equity curve. Compared to July where I lost -12%, I only lost -3.28% this month – which considering I had a dismal 26% win ratio, I think that’s actually pretty good!
I essentially lost 8 out of 10 trades on average this month and yet I only gave back a fraction of my equity. This is because I’m managing my risk well: my max adverse excursion (biggest single trade loss) is still only -1% while my max favorable excursion (biggest single trade win) was +4.23%.
But this is not cause for celebration. I did lose money this month, so I can’t exactly pat myself on the back for doing that. But I am glad that my strategy is at least containing my losses and keeping my account alive instead of blowing all my money like I would have in the past in a situation like this.
Right now I’m in a statistically-significant drawdown. That is to say that -18% is very close to my max expected drawdown according to my backtesting results AND my max pain tolerance as a trader (which is around -25% given my current account size).
Three to four months is my maximum drawdown length according to my backtesting, and about -20% is my maximum historical drawdown depth. Of course live markets behave differently to the past, so no matter how reliable historical patterns are, there is always a chance that a rare losing streak might happen where the strategy exceeds its previous max drawdown metrics.
I don’t know if that’s going to happen here. But I am in a tricky situation. On the one hand – just because my strategy is currently under-performing my average backtesting results doesn’t mean that I should immediately hop to a new strategy.
There’s no guarantee that a new strategy won’t also enter a drawdown – and perhaps I’ll go from one strategy drawdown straight into another and potentially double my losses. So strategy hopping is not a solution right now. That is a trap that many traders fall into and never escape.
But if this strategy’s results do not improve over the rest of this year, then I’m in a pickle. Because if my current strategy isn’t performing, and yet strategy hopping is not a solution, then what is the solution?
I believe that modifying my strategy rules to improve its edge is the best solution for the time being. Improve what I already have; don’t start this process all over again from scratch with a new strategy – because then I lose all of the metrics and statistical data I have to work with to identify recurring patterns in both the markets and my trading results.
Because I have been so consistent with my trading, I have identified several areas in my strategy that I believe could be improved both from a technical analysis standpoint as well as a risk management standpoint.
So now for the next few weeks, as I’ve said in my past journals – I am going to continue the process of backtesting to try to find ways to improve my win rate for this strategy. I’m experimenting with different exit reasons, different money management techniques, different timeframes and different markets.
For example – I’ve been wondering if trading 2 positions on the 1-Hour timeframe is holding back my trading results. Because even if I manage to capture a 6R move, I only make 3.5R out of it due to the nature of taking my first target (and therefore half of my position off) at 1:1.
This rule is designed to reduce my drawdown severity, but recently I have been questioning whether or not it’s also reducing my average gains in a way that is sabotaging my potential return. So I’m testing variations of this strategy with a single position or with two positions but using a wider first target etc.
What I’ve tested so far shows promise, but I’m still not quite there yet. I’m not comfortable changing my strategy rules just yet. I need more time to compare backtesting results of various changes before I make any important strategy decisions.
I also have the option of adding new strategies to my existing trading plan to further diversify my market exposure which might reduce my max drawdown metrics. This is another avenue I’m considering, but I have so much backtesting to do already that I’m not sure when I’ll get time to test brand new strategies. We’ll see.
PS. For anyone who’s interested, I’m also going to be testing these trade management ideas from my trading mentor to see if they improve my strategy’s performance:
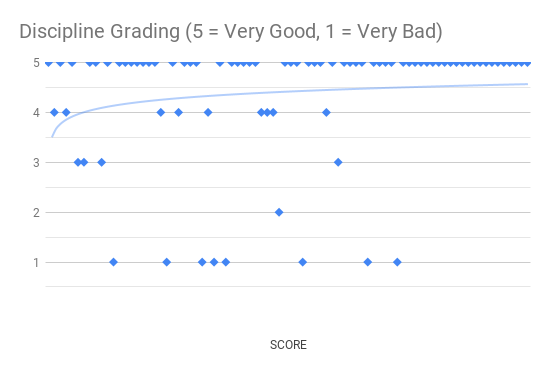
Discipline Review
There’s not much to say in this month’s discipline review. I only screwed up once, and that was because I placed a trade with a position size that was half of what it should have been.
That trade ended up losing, so in the end that mistake actually helped my equity curve. Of course that means nothing – any trading mistake is a bad thing regardless of whether it made you or lost you money.
The goal is to be consistent and to make no mistakes. But mistakes happen, and if they happen to profit you, then that’s obviously better than losing money!

As you can see, my win rate for September was shockingly bad. 26% is not good any way you cut it.
But my MFE (max favorable excursion) was 4.23% while my max losing trade was still 1%. So all things considered, those two metrics held my month together and prevented it from being much worse.
By letting my winners run and cutting my (many and frequent) losses short, I managed to keep this ship afloat. I can make back the money I lost this month in a single good trading week, so it’s nothing to fret about.
Hopefully I can discover some new ways to improve my strategy performance throughout the next few weeks and months of backtesting, but in the meantime I will continue to trade this strategy the way it stands.
According to my testing over thousands of trades and several years, until I exceed a -25% drawdown there’s absolutely no reason why this strategy can’t recover. If I hit that number then I will probably pull the plug on my trading for a while until I am confident with a new trading plan. But we’ll cross that bridge when we come to it. There’s still a high chance that the strategy will recover.
But in order for that to happen I need to remain consistent and unwavering in my execution. So check back next week to see how things are progressing, and good luck with your own trading!
– Matt.
Next Week’s Goal
Execute my plan flawlessly.
Previous Week’s Review
This Week’s Review
Myfxbook Stats

