Weekly Review #38

Table of Contents
Forex Trading Review – Week 38
This week was another mediocre sideways week. Nothing exciting, nothing to be concerned about – just another break-even week in the trading grind.
16th September – 20th September
Trade #189
| Market | EUR/JPY |
| Date & Time | 16/9/19 9:00 AM |
| Daily Trend | Bullish Reversal |
| Timeframe | 15M |
| Strategy | Pullback X |
| Result | B/E |
| Verdict | Error Trade |
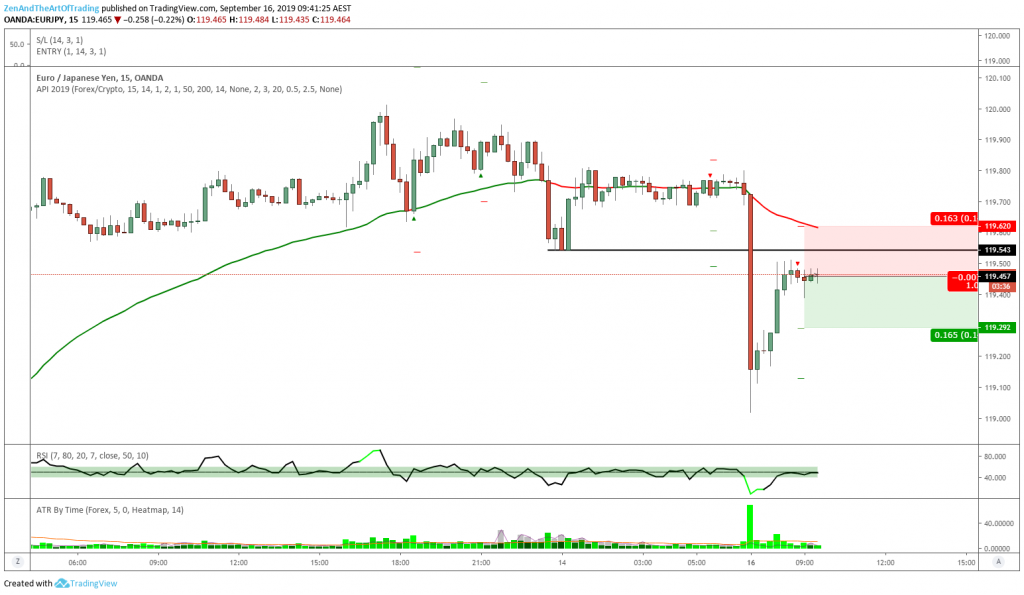
Before 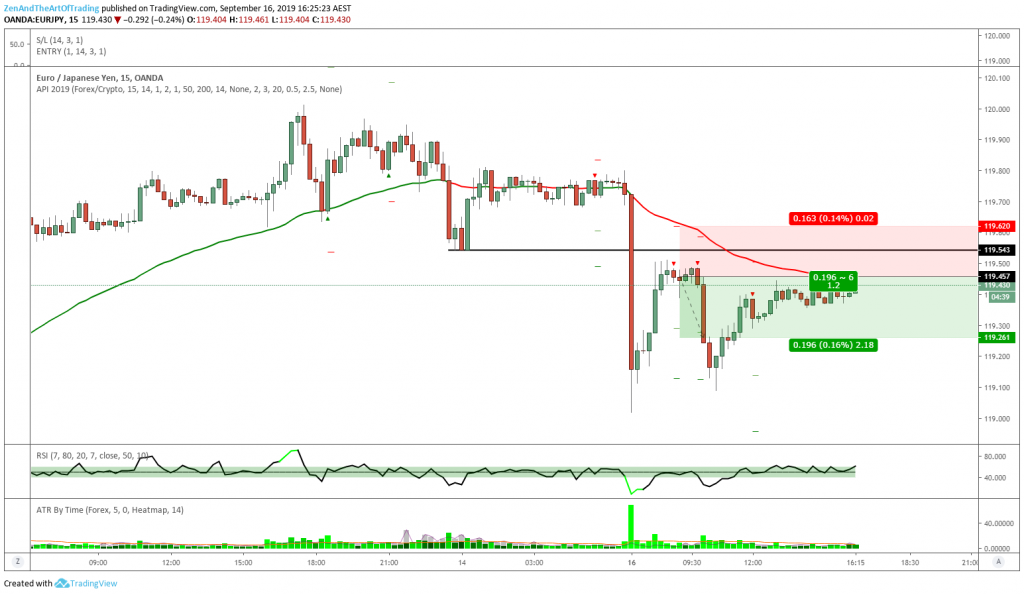
After
Reflection:
I took this trade on Monday morning. Normally I don’t trade EUR/JPY on Mondays, but given the magnitude of the gap down over the weekend, I knew that this setup had a high likelihood of playing out profitably.
However I was unable to exit the trade when price printed my exit reason, because I was in a nursing home visiting my grandmother who recently developed dementia. By the time I got back into my car and checked my charts, the trade had already reversed too far for me to exit for a profit.
So I left my position on hoping for a retest of the lows which would allow me to exit the trade for a 1R+ gain, but I was stopped out for break-even instead.
No big deal – I was frustrated by this obviously, but there are more important things in life than trading and my grandmother enjoyed my visit, so it was a worthwhile trade as far as I’m concerned.
I’m still writing this up as an error trade though, as this wouldn’t have happened if TradingView had emailed me my exit alert. But because I was in a rush to leave the house, I forgot to set the alert to send me an email – which is 100% my fault and could have been avoided if I’d been more focused in the morning before leaving the house.
Trade #190
| Market | USD/CAD |
| Date & Time | 16/9/19 3:00 PM |
| Daily Trend | Bearish |
| Timeframe | 15M |
| Strategy | Pullback X |
| Result | -1.00% |
| Verdict | Good Trade |
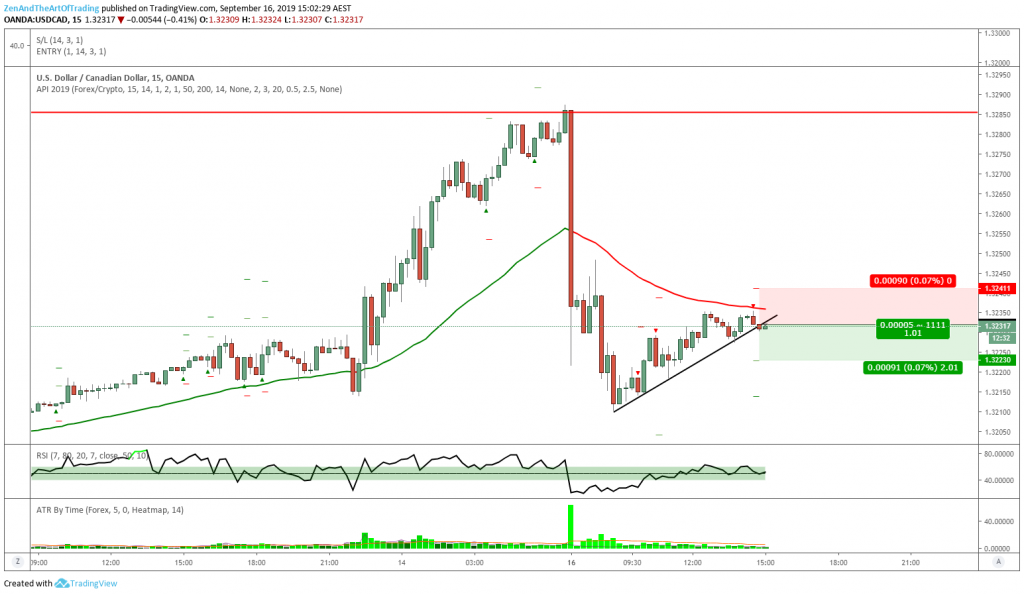
Before 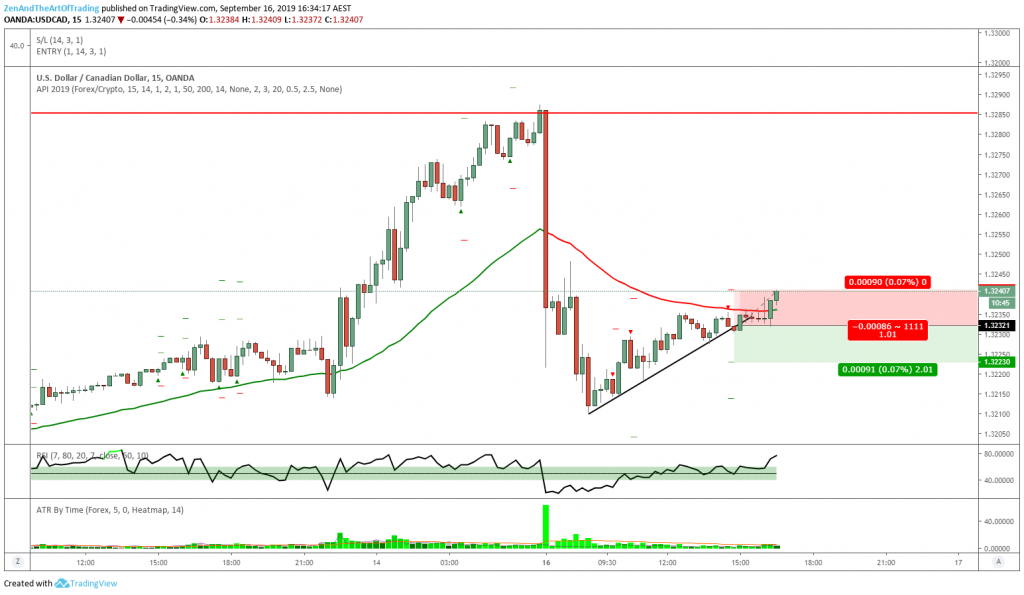
After
Reflection:
This was a good trading setup according to my rules.
Price had just impulsively rocketed below the 50-EMA after rejecting from a key higher timeframe resistance zone (the red line). Typically this type of setup under these particular conditions has above a 50% win rate.
This time the cards did not play out in my favor, but I’d take this setup 100 times out of 100 opportunities. So it was a Good Trade!
Trade #191
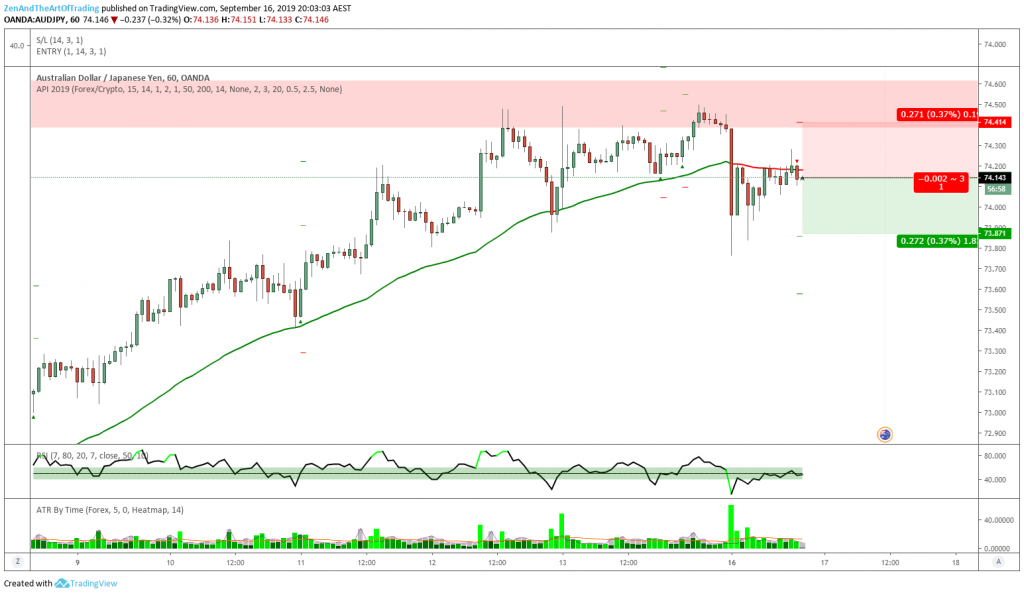
| Market | AUD/JPY |
| Date & Time | 16/9/19 8:00 PM |
| Daily Trend | Testing Resistance |
| Timeframe | 1HR |
| Strategy | Pullback |
| Result | Ongoing |
| Verdict | Good Trade |
Before 
During
Reflection:
This was my biggest winner for the week, and quite a fun trade if I may say so myself.
There’s few things better in trading than capturing a large up-move in a market, and then capturing the reversal and large retracement, too. That’s what happened here.
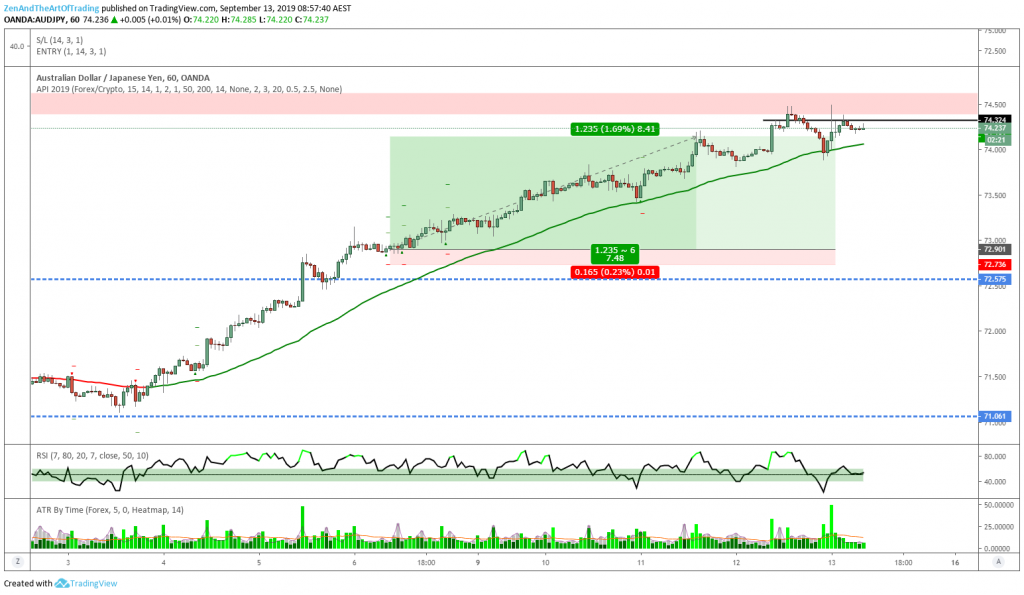
If you remember, last week I caught a 7R winner on AUD/JPY:
Well, after price tested and rejected from that Daily resistance zone at 74.500 I managed to catch a reversal setup in the bearish direction. At the time, the Daily chart looked like this:
I’m trailing my stop loss on my second position until price either gives me an exit reason in this blue support zone at 72.500 (a 1-Hour double-bottom or a 4HR bullish engulfing candle), or breaks through into new lows.
I am expecting 72.500 to act as support given the large bullish reversal move out of the consolidation range at 71.000 and the fact that price had temporarily reclaimed the 50-Day EMA.
This week should tell us if AUD/JPY has the juice to make new highs or if this was just a complex bearish pullback before trend-continuation lower.
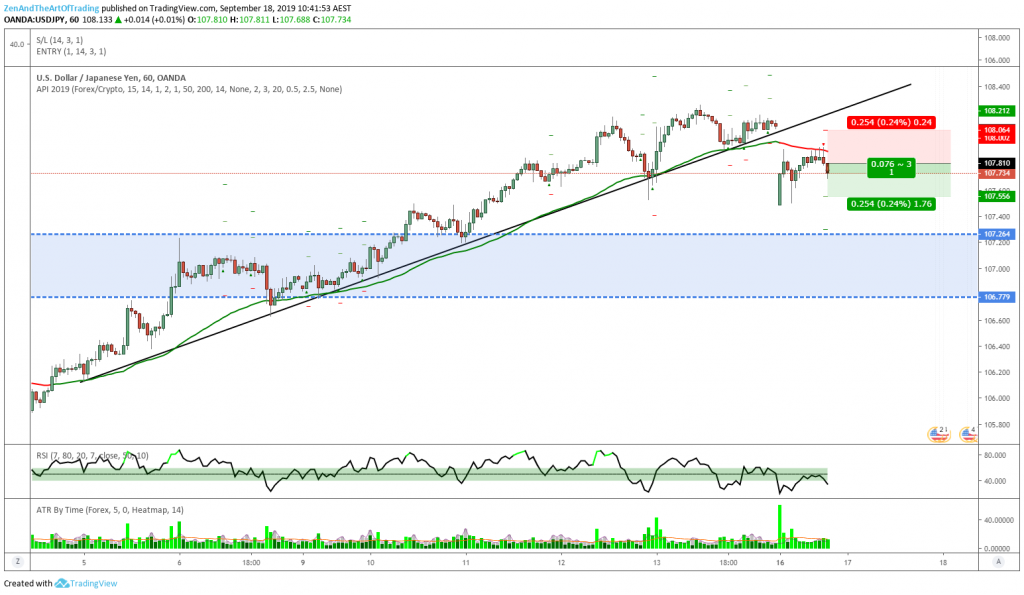
Trade #192
| Market | USD/JPY |
| Date & Time | 16/9/19 10:00 PM |
| Daily Trend | Bullish |
| Timeframe | 1HR |
| Strategy | Pullback |
| Result | -1.00% |
| Verdict | Good Trade |
Before 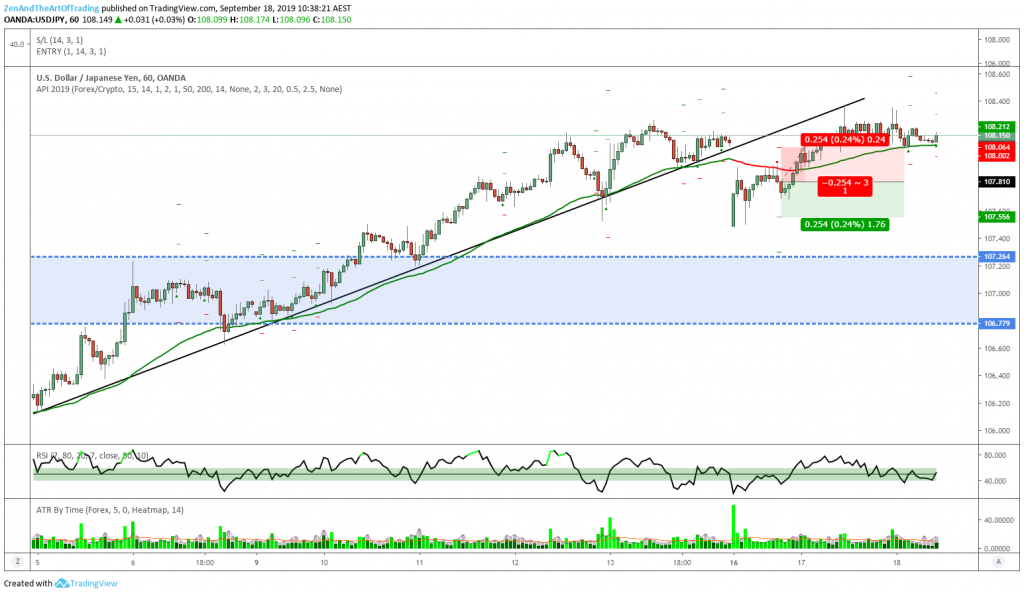
After
Reflection:
This seemed like a good setup – a gap lower that broke and closed below a multiply-tested trend-line and 50-EMA.
I don’t trade off trendlines themselves, and the trendline did not influence my trading decision in this particular case. In fact I didn’t notice it until after I’d placed the trade.
But you can’t argue that this trendline was acting as support in confluence with the 50-EMA for quite a while on this timeframe, so I believe it was sensible to predict that if it was compromised then price had room to retrace lower into the blue support zone.
Obviously that didn’t happen here, and price instead continued higher to retest the highs before eventually rolling over to the downside.
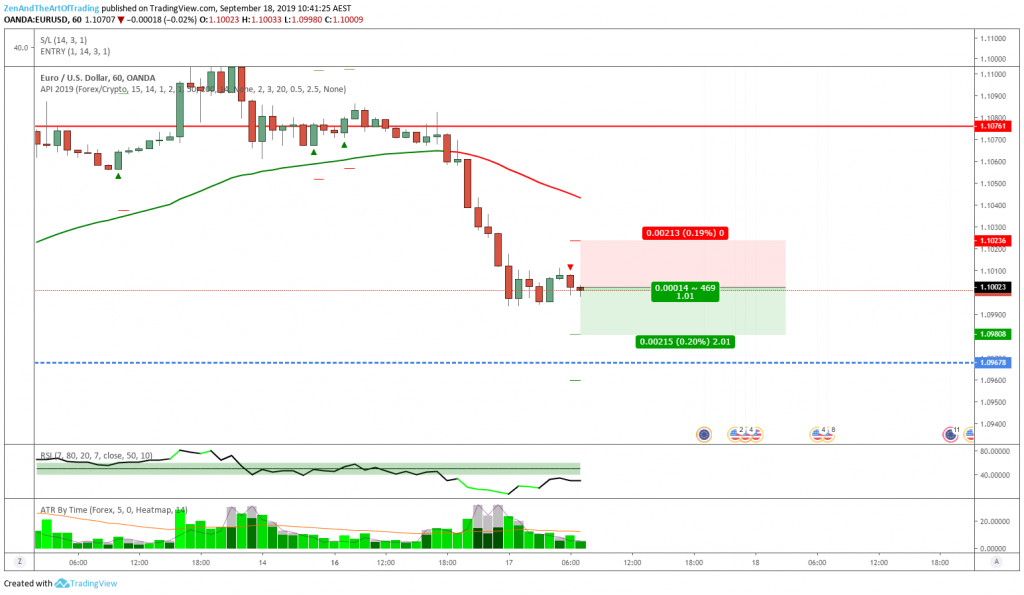
Trade #193
| Market | EUR/USD |
| Date & Time | 17/9/19 9:00 AM |
| Daily Trend | Bearish |
| Timeframe | 1HR |
| Strategy | Pullback |
| Result | -0.99% |
| Verdict | Good Trade |
Before 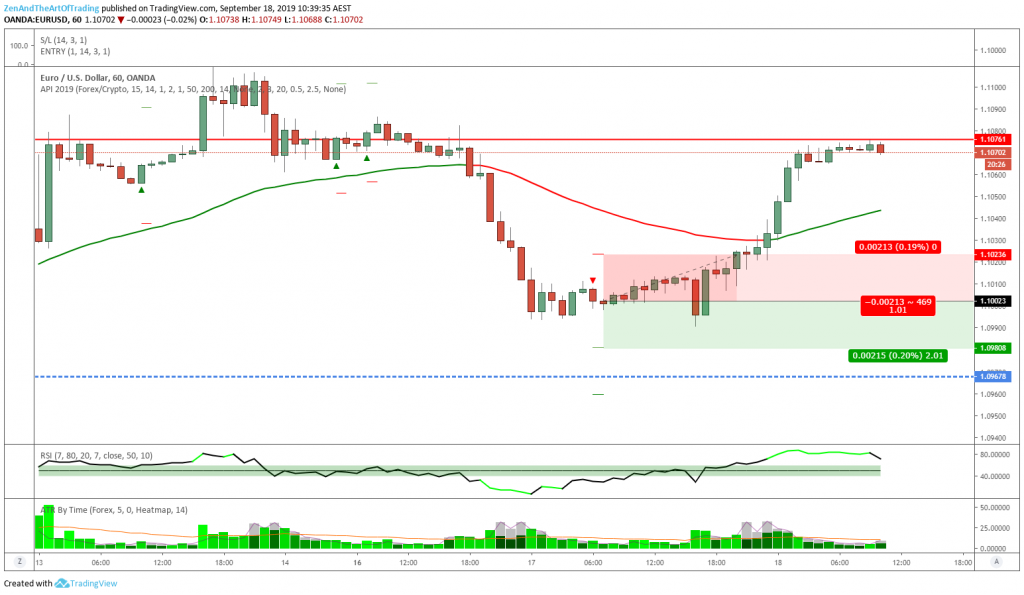
After
Reflection:
This was a typical pullback trade. Not much to talk about here.
Price made an impulsive move below the 50-EMA taking out a bunch of minor support levels, and there was plenty of room to continue lower to higher-timeframe support.
But price decided to reverse in the middle of nowhere this time, stopping me out.
Trade #194
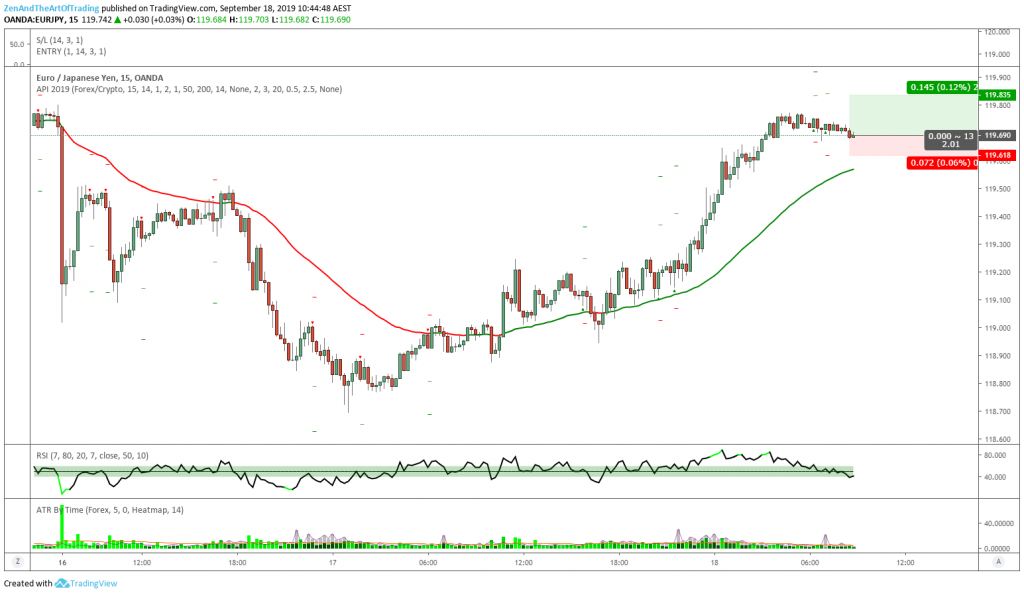
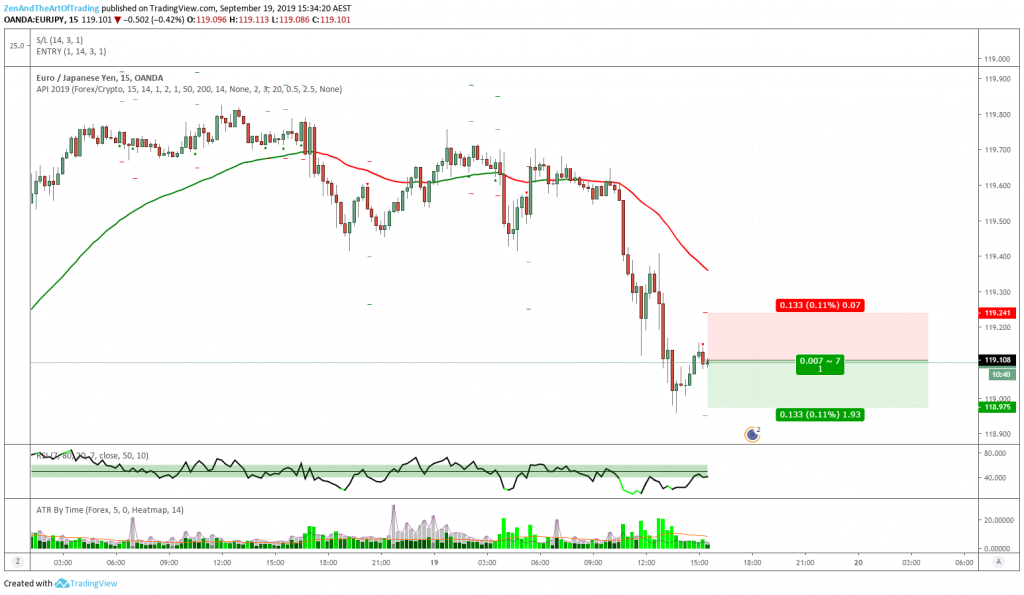
| Market | EUR/JPY |
| Date & Time | 18/9/19 10:30 AM |
| Daily Trend | Bullish |
| Timeframe | 15M |
| Strategy | Pullback X |
| Result | B/E |
| Verdict | Good Trade |
Before 
After
Reflection:
This was another typical garden-variety pullback setup.
After price had made this impulsive bullish move above the EMA which broke through several resistance levels, I knew that my strategy had a decent chance of capturing the final blow-off top of this move.
Unfortunately the blow-off top ended up being a bit anticlimactic and price made a false breakout and then trickled lower, stopping me out for break-even.
Trade #195
| Market | USD/CAD |
| Date & Time | 19/9/19 3:30 PM |
| Daily Trend | Bullish |
| Timeframe | 15M |
| Strategy | Pullback X |
| Result | -1.03% |
| Verdict | Good Trade |
Before 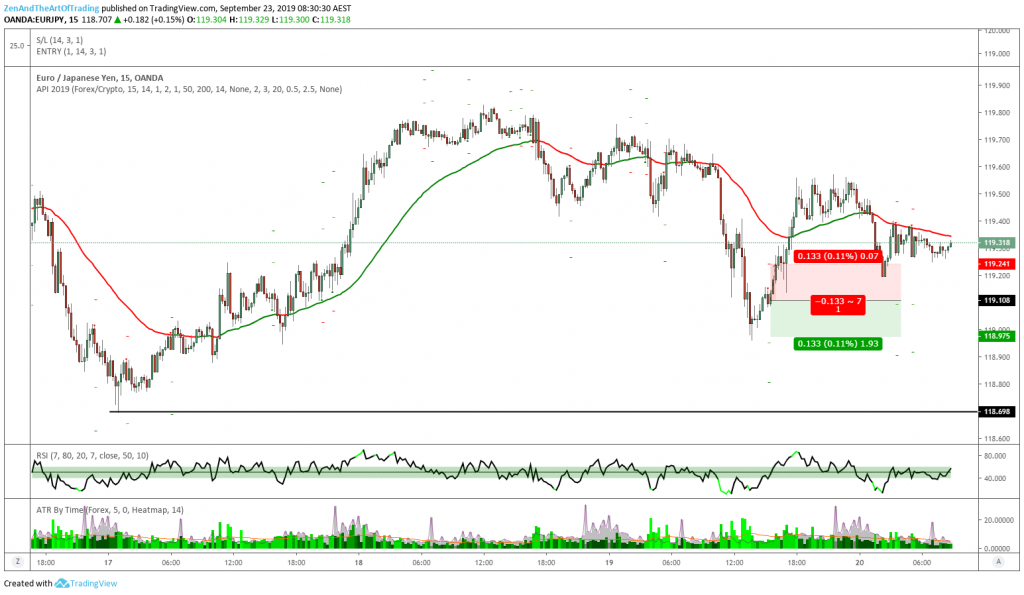
After
Reflection:
My final losing trade for the week was another momentum pullback trade.
Price was making lower lows and lower highs below the 50-EMA and had plenty of room to continue lower until higher timeframe support, but yet again price decided to reverse off a minor support level in the middle of nowhere instead.
Weekly Reflection
Annual Return: +7.64% | Drawdown: -16.29%
Last Week’s Goal: Execute my plan flawlessly.
Overall Grade: A
This week was not great for my morale, but not terrible for my equity curve. It ended up being basically another break-even week.
I’m not exactly stressed about this prolonged multi-month drawdown, but I am very frustrated that I’ve taken so many good trades the past few weeks and yet I haven’t made a dime.
Obviously this is an experience that all traders must endure sometimes – even elite traders. But given the fact that I’m still a developing trader who has only recently seen consistent profits, I still have a lot of work to do on my edge.
So I’ll be spending the next few weeks continuing my backtesting process to try to enhance my strategy’s accuracy (or at least reduce its drawdowns).
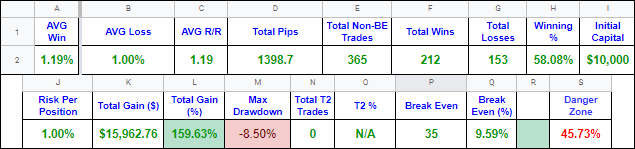
I’ve managed to get my 15-Minute pullback strategy up from a 45% win rate to a 58% win rate by tweaking my exit criteria, but that also lowers my average win amount so that my average R/R is around 1.2R.
I still have a few more adjustments to test before I’ll feel comfortable transitioning to this strategy, but I must admit I like its potential. All I did was change my exit reason from a lower-low lower-close/higher-high higher-close at 2:1R to 1:1R.
This means I capture many more frequent small wins which keeps my drawdown low, while it occasionally captures large winners that boosts the equity curve over time.
This means there are prolonged periods where the strategy has a negative R:R (ie. making 0.5R per 1R of risk). With a win rate above 50%, this is maybe not a big deal. But if my win rate falls below 50% for a prolonged period of time, this could end up hurting me.
So I have to do some more testing across multiple pairs and timeframes to see if this strategy is robust enough to withstand the test of time. Until then… I will continue executing my plan as it stands, and hopefully one week soon I will hit a string of winners that will put a dent in this double-digit drawdown.
Good luck with your own trading, see you next week!
Next Week’s Goal
Execute my plan flawlessly.
Previous Week’s Review
This Week’s Review
Myfxbook Stats

