Top 5 MOST EFFECTIVE Strategy Filters
Table of Contents
Top 5 Trading Strategy Filters
Hey traders!
In today’s blog post I’m going to share some ideas regarding various types of filters you can use to enhance the accuracy or performance of your trading strategies.
But first of all – what are strategy filters?
What Are Filters?
“Filters” are specific conditions you add to the rules of a strategy with the goal of filtering out low-quality trades and improving your average profit and/or reducing your average drawdown.
Most traders use filters that are usually based on market conditions, time conditions, indicator conditions or price action conditions – but a filter could be any other kind of yes/no condition that you can think of.
There are many creative ways to employ filters and I can’t possible explore all of them – but with a bit of imagination you can turn an unprofitable or under-performing strategy into a winning strategy by experimenting with various filters.
In today’s post I’m going to list my personal favorite top 5 filters that I’ve used in my own trading over the past few years to successfully improve the performance of my various strategies.
Always make sure to backtest your filters before using them in your strategies. This is important, because sometimes filters that sound perfectly good in theory can actually hurt your strategy’s performance depending on the market, timeframe and style of trading you are working with.
Moving Average Filters
This is one of my favorite trading filters, and it’s also one of the simplest types of filters.
There are many ways you could employ a moving average filter, but the way I tend to use it is quite simple:
If price is above a given moving average I look for long trades, if price is below a given moving average I look for short trades.
For me this is usually the 50-EMA, but any popular moving average could work depending on the market and timeframe you’re trading. The most popular ones I tend to see professional traders use is the 20-period, 50-period and 200-period moving averages.
It doesn’t matter which type of moving average you use as they all have pros and cons, but the most popular are EMAs and SMAs.
I’ve also seen professional traders use VWAP as a filter particularly in crypto and stocks. They might have a strategy that involves a price action pattern they like to trade, but they will only trade that pattern if it occurs above or below this “line in the sand”.
The main idea behind this style of filter is to keep yourself always trading in the direction of the underlying trend or momentum. Therefore it is best employed as a trend-following, trend-continuation or momentum-based strategy filter where the goal is to trade with the wind at your back instead of against it.
Regime Filters
This filter is similar to the moving average filter, but with one major difference: instead of using the moving average filter on your trading market and timeframe, you use it on a leading market or timeframe.
Regime Filters are most effective in stock trading or crypto trading where there is an index or market leader that tends to drag the tide of the rest of the market with it.
Nick Radge (a professional Australian trader who goes by the alias “TheChartist“) is a huge fan of this type of filter and employs it in his stock trading strategies. In fact he might be the first person I ever saw use this particular filter, but many other professional traders use it as well.
The idea is simple: if you’re trading a market that is heavily influenced by a central market leader (eg. the S&P500 for U.S. stocks, or Bitcoin for the altcoin market), then you only take long trading setups when that leading market is above a key moving average (or short only when it’s below).
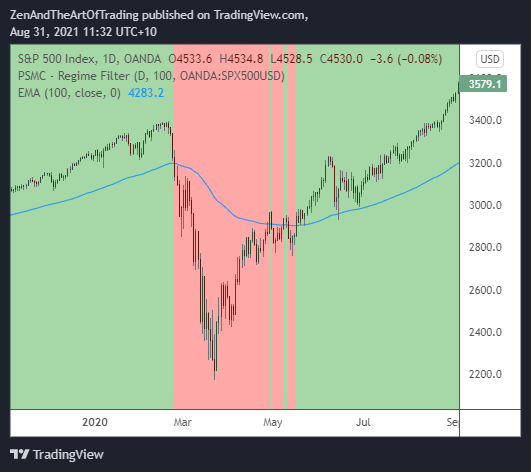
This filter is usually applied to the daily or weekly timeframe of the leading market, and should be a key level that indicates a bullish trend or a bearish trend.
One example would be only trading long setups on U.S. stocks when the S&P500 index is trading above its 200-day moving average, and staying out of the market when it’s below as this usually means the S&P500 is in a bearish trend or significant correction and is likely to drag the rest of the market down with it.
This filter can be used on any major market – eg. only trading Australian stocks to the upside when the AU200 is above its 200-day MA, or only trading Indian stocks to the upside when the NIFTY50 is above its 200-day MA etc.
Another example might be only buying altcoins while Bitcoin is trading above its 20-week moving average. This is an extremely effective filter as when Bitcoin is above its 20-week moving average altcoins tend to be quite bullish. This is a key level I watch in my own crypto trading and investing and it dictates how aggressive or conservative I am with my risk apetite.
In the case of Bitcoin, if you monitor the 20-week moving average and notice that Bitcoin is consolidating above it, you’ll also notice that the entire altcoin market often goes crazy and this is when we tend to see massive moves across the board particularly in the top 100 coins.
Depending on your trading or investment strategy, staying out of the altcoin or stock market whenever these regime filters are not met is a great way to avoid large drawdowns while still being there for the majority of the bigger, more meaningful moves to the upside.
Price Action Filters
There are certain price patterns or zones in the markets that make for great price action filters.
For example there was a pullback strategy I was working on a few years ago that traded bullish and bearish engulfing candles above/below the 50-EMA.
And on certain timeframes I found that not trading an engulfing candle with a rejection wick that was twice the size of the body enhanced the performance of my strategy over the long-term.
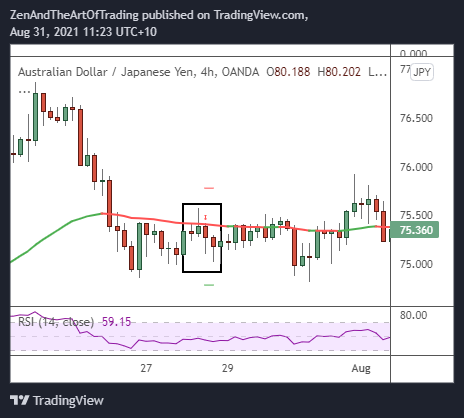
The idea behind this filter was simple – an engulfing candle is supposed to be a sign of reversing momentum, but if the engulfing candle has a large rejection wick in the opposite direction then that indicates that perhaps the momentum isn’t shifting quite as strongly as an engulfing pattern should indicate.
Another price-based filter I like to use is to ignore trading setups where the entry candle has a total size greater than 2-3x the current ATR value, or at least wait for a deeper pullback into the trading setup to provide a better risk:reward profile.
This is because usually a massive entry pattern comes with wide stops & targets which can reduce the likelihood of your trade playing out profitably, especially if your target falls beyond market structure.
Which brings me to the last price action filter I personally use in my trading – structure-based conditions.
I really enjoy trading counter-trend double-tops and double-bottoms… but not just anywhere.
This pattern can fail frequently, especially if it occurs during a strong trend. But if you wait for price to enter a zone of major support or resistance, it can significantly increase the accuracy of this particular trading setup.
I employ structure-based filters in all of my counter-trend strategies.

I am a trend-continuation trader at heart, so trading against the trend doesn’t come naturally to me – unless the counter-trend setup occurs within a major support or resistance zone and gives added confluence that the setup has a high likelihood of playing out profitably.
Time Filters
There are three types of time filters I like to use in my trading and investing strategies:
Time of Day Filters
This is a filter based on a specific time of day.
It can either mean that I don’t take trading setups during that time, or I only take trading setups during that time.
I recently created a video teaching traders how to code a Pine Script strategy to trade a strategy which employed a time filter. Click here to see the video lesson if you’re interested.
The strategy is called the “Follow the Bear” strategy and is intended to ONLY be traded during the European open. It exploits a recurring price action pattern that frequently unfolds around 2AM-7AM New York time (around 7AM-12PM London time, or 5PM-10PM my time here in Australia).
The strategy is not profitable if it’s traded outside of these hours.
As a forex trader who deals with markets that are open for 24-hours each day, I’ve found Time of Day filters to be quite helpful in improving the performance of certain styles of intraday strategies.
There are particular times of day in the forex markets when volatility dries up or expands, and certain strategies perform better if you either ignore low-volatility trading sessions or specifically target high-volatility trading sessions.
Day of Week Filters
Day of Week filters are exactly what they sound like – they’re filters based on the day of the week.
The Follow the Bear strategy which I mentioned in the Time of Day Filters example above also employed a Day of Week filter.
During my backtesting I found that Mondays and Fridays were particularly bad for the strategy and in fact were not profitable over the 300+ trades I tested.
It improved the strategy to literally not trade it on those days.
I have a great quote pinned to my office wall behind my computer here that I often reflect on. It’s something that Jesse Livermore said in his infamous book Reminiscences of a Stock Operator:
“Remember this: when you are doing nothing, those speculators who feel they must trade day in and day out, are laying the foundation for your next venture. You will reap the benefits from their mistakes.”
Jesse Livermore
In the past I used to suffer from this affliction of constantly feeling like I needed to be involved in the markets with open positions in order to be a profitable trader, so this quote really stuck with me when I first read it.
And it’s a philosophy I like to include in my trading strategy development process. I always check the data on my trading to see if there are times of day, or days of the week, when I ought to do nothing.
Another quote from Jesse Livermore:
“There is time to go long, time to go short and time to go fishing.”
Jesse Livermore
Seasonality Filters
This is an admittedly odd one that most traders might not think of.
But there are certain seasons throughout the year when markets tend to behave a certain way.
This applies to all markets, but some markets exhibit seasonality characteristics much more obviously.
An interesting example is Gold. The price of gold is affected by all kinds of global events and the usual supply and demand mechanics of a commodity market, but it is also affected by the Indian wedding season.
Every year around 20 million weddings occur in India, and the Indian wedding culture involves a lot of gold. So much gold that this time of year tends to drive the price of gold up as millions of people rush to buy the most lavish gold jewelry they can afford as it is believed to bring good fortune.
It certainly does bring good fortune, and even better fortune to those traders who increase their long position sizes during this time of year.
According to a 2016 report the Moore Research Centre pointed out that over the last 15 years, traders buying gold on or around September 15 and selling around October 8 would have been profitable around 80% of the time.
The U.S. stock market also has an element of seasonality to it. A great American trader (and the very first trader I was ever introduced to at my first trading seminar in Sydney Australia) called Courtney Smith employs seasonality in his stock trading strategies in a big way.
During certain months in the year he doubles his position sizing (ie. his risk) to exploit the bullish seasonality of those times of year. He even has a catchphrase for this phenomenon – “Sell in May and go away!”
As he says in this blog post: The stock market has a bullish seasonality that starts at the beginning of October and extends to the end of April.
I’ve heard that crypto has a seasonality as well. And the Forex market definitely gets quieter during the American summer period.
If you are an experienced trader it might be worth employing a Seasonality Filter into your trading to take advantage of these market tides.
Indicator Filters
The final conditional filter I like to use in my own trading is various Indicator Filters.
This could be literally anything. Pick your favorite indicators, go over your trading data, and see if there are certain indicator conditions that either improve or hurt your trading performance.
One of my trading mentors Steven Hart made a video on an interesting strategy he developed using the RSI as a filter. But not in the way you might think.
While there are some great strategies out there that employ RSI filters for things like counter-trend trades and divergence setups, he found a way to use the RSI indicator as a trend-continuation and momentum filter.
The RSI was originally designed to measure the momentum of a market. And so while it’s true that if it’s “overbought” or “oversold” that typically means a market is close to exhaustion, it also means that the market has very strong momentum.
If you’ve ever traded crypto then you know that just because the RSI goes “overbought” doesn’t mean the market is about to reverse – in fact the RSI can stay overbought for literally weeks:
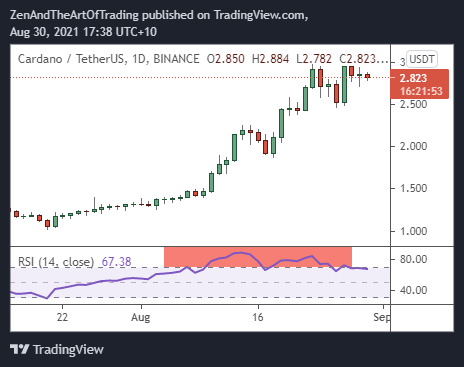
Earlier this year Steven released a video exploring the idea of using the RSI not as a counter-trend condition, but as a momentum-continuation condition to trade in the direction of the extreme momentum – and it turned out to be a profitable approach to trading!
Instead of selling when the RSI went “overbought” he bought the market, and instead of buying when the RSI went “oversold” he went short.
This is an example of employing a creative indicator filter.
But there are thousands of indicators out there – from Stochastics to Bollinger Bands to MACD to Ichimoku Clouds.
An indicator by itself does not make for a profitable trading signal. But combining an indicator’s conditions with price action conditions can produce a profitable trading strategy.
The advantage of using indicators combined with price action is that indicators give you an objective reading on price data analysis. An RSI is either “overbought” or it’s not. And while indicators are typically lagging interpretations of price data, when you combine them with live price action you can create an edge over the markets.
Last year when I was doing client coding work in Pine Script I had a trader reach out to me to help him code his strategy into an indicator.
One of the filters in his strategy was the Ichimoku Cloud.
I’d never used the Ichimoku Cloud in any strategy and I had no idea how it worked, but I followed the trader’s instructions and coded a script that traded price action patterns above and below the cloud.
It turned out to be quite a profitable strategy, and without that Ichimoku filter the strategy was completely useless and unprofitable.
So do not underestimate the power of indicator filters. When used properly and appropriately they can be a powerful ally in your strategy development process.
Other Filters & Summary
There are obviously an infinite amount of filters you could choose to use in your trading, and this list is by no means an exhaustive one.
These are just the filters I’ve personally used to successfully enhance the performance of some of my trading strategies.
But a few other ideas to explore if you’re interested might be:
- Fundamental Filters (eg. determining a directional bias based on fundamental data of a market)
- Sentimental Filters (eg. determining a directional bias based on sentimental analysis of a market)
- Positioning Filters (eg. developing a bullish bias if there is a large imbalance of short contracts on a market)
There are also many different ways you can use filters to inform your trading process outside of just filtering out trading setups.
For example, if you discover that your strategy performs particularly well under certain market conditions but is also profitable outside of those conditions, rather than filter out all trades that don’t occur while your filter is met you could instead increase your position size to capitalize on those times when market conditions are particularly conducive to your strategy.
Or the opposite – reduce your risk slightly when market conditions are less favorable and your trades aren’t quite as likely to play out profitably.
Just some food for thought.
Take care and best of luck with your trading!


This is great content. Amazing stuff, keep up the good work man. Is there anyway to use a filter outside of a strategy. Say for instance, I have a certain study/strategy that I don’t have the source code for but have access to – can I apply the filter to that strategy without having to change the main indicator’s source code? Seems like it should be quite simple but I can’t “get it”. Would be great if anyone could help.
Thanks,
Mark
Hi Mark! Thanks for the kind words :) unfortunately if you don’t have access to the source code of the indicator you’re using then you can’t add the filter directly to the script. But of course you could just manually apply the filters you want to use. For example if you wanted to use a regime filter, you could write a script that turns the background color of your chart red whenever the S&P500 is below the 200-day moving average and just ignore your indicator’s setups whenever the chart is red. That’s how I would add filters to my trading… Read more »