RSI Alerts – Overbought/Oversold Indicator
This is a very simple but useful indicator that draws visual RSI signals to your chart. You can also use it to set RSI alerts whenever a market enters an extreme RSI condition.
How It Works
Whenever the RSI is above the given Overbought threshold the script will draw red arrows above the candles.
Whenever the RSI is below the given Oversold threshold the script will draw green arrows below the candles.
I personally use this on my spare chart monitors that track various market indexes. It is very useful for reducing chart indicator clutter while also being able to tell at a glance if RSI is overbought or oversold.
Settings
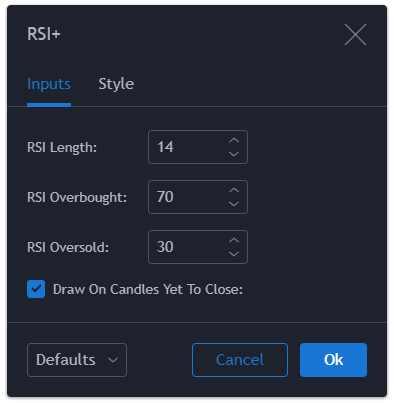
RSI Length:
This sets the calculation period for the RSI.
RSI Overbought:
This sets the overbought threshold.
RSI Oversold:
This sets the oversold threshold.
Draw On Candles Yet to Close:
If disabled then the script will not draw signals on the current candle until the candle closes.


Source Code
// Created by Matthew J. Slabosz
// www.zenandtheartoftrading.com
// @version=3
study(title="MJS - RSI+ (Overbought/Oversold Indicator)", shorttitle="RSI+", overlay=true)

// Get user input
rsiLength = input(14, title="RSI Length:", type=integer, minval=1)
rsiOverbought = input(70, title="RSI Overbought:", type=integer, minval=1)
rsiOversold = input(30, title="RSI Oversold:", type=integer, minval=1)
drawOnRT = input(title="Draw On Candles Yet To Close:", type=bool, defval=true)

// Check to see if RSI has crossed our threshold
rsi = rsi(close, rsiLength)
rsiOB = rsi >= rsiOverbought
rsiOS = rsi <= rsiOversold

// Plot signals and trigger any alerts
plotshape(rsiOS and (barstate.ishistory or drawOnRT), title= "Oversold", location=location.belowbar, color=green, transp=0, style=shape.triangleup, text="")
plotshape(rsiOB and (barstate.ishistory or drawOnRT),  title= "Overbought", color=red, transp=0, style=shape.triangledown, text="")
alertcondition(rsiOB or rsiOS, title="RSI+ Alert!", message="RSI Alert for ")
Last Updated: 21st March, 2019


Hi – can you explain how the alerts work? I’m looking to get email and SMS alerts from TradingView. Thanks!
Hey Matt! Sure thing man.
Here’s an article I wrote covering the essentials of alert-setting in TradingView: /how-to-set-tradingview-alerts/
And here’s a video recently I made for one of my own indicators, maybe you will find that helpful too:
Hi, this looks great–does it work with Mac in AppleScript or some other program? Would like to get more control over RSI in my trades, but have never used a script before. Thanks!
Can I make the signal show on the RSI chart instead of on the candle bar? When RSI cross the OB and OS lines then the arrow/triangle shape show exactly where they are cross. Thanks!