February 2019 Review
Table of Contents
Forex Trading Review – Week 9
I have decided to publicly post my trading journal on this blog.
I trade alone at home, and although I have a mentor and some trading buddies, I must admit that trading can at times feel a bit lonely. When I have a good week, I have no one to talk to about it. And when I have a bad week, I have nothing to be embarrassed about because nobody knows.
Well, I’d like to change that with this trading journal.
A big part of my trading journey has been learning from my mentor, Steven Hart. One of the things he does in his training program is review his equity curve regularly to show students what it is like to endure drawdowns and come out the other side.
This has been a very powerful motivator for me to stick to my own plan and emulate his discipline so that I can generate a somewhat similar equity curve.
So, without further ado… welcome to my trading journal, where I will openly discuss the concepts and habits that I am personally struggling with and hopefully share the journey of overcoming them with you – my fellow students of the markets.
Myfxbook Stats
First I will break down each individual trade and post the chart and explain why I took them and what I learned from them. Then I will use screenshots of Myfxbook stats to make the overall analysis of my performance easier.
Click here to access my personal Myfxbook page to see my stats in more detail. You can see my open trades and trading history there.
I will not include my $ balance in my journal, not because I don’t want anyone to know how much money I am trading (spoiler alert: it’s not a lot, I’m still learning) – but because focusing on the $ amounts is in fact counter-productive to your advancement as a trader.
I am only concerned with % returns and losses. Even when I pay commissions I think of the cost in terms of % and not $. The forex markets are the most liquid markets in the world which means that whether you’re trading $1,000, $10,000 or $100,000, your system and your strategy can scale indefinitely.
By focusing on performance metrics instead of results metrics you can really accelerate your learning curve and develop better trading habits much faster – allowing you to trade much bigger.
In January I began trading a new strategy that I had spent all of 2018 developing and testing. I went straight into a 9% drawdown which wasn’t exactly encouraging.
But I quickly identified where I was going wrong and acknowledged that how I was trading was not the same as how I back-tested the strategy. So I doubled-down on my process and began journaling extensively.
I have since traded my way out of that drawdown and back to slightly above break-even for the year.
So this journal is starting in March instead of January, where I feel like I am ‘starting again’ as it were, and I will be updating it weekly from now on.
25th February – 1st March
Trade #16

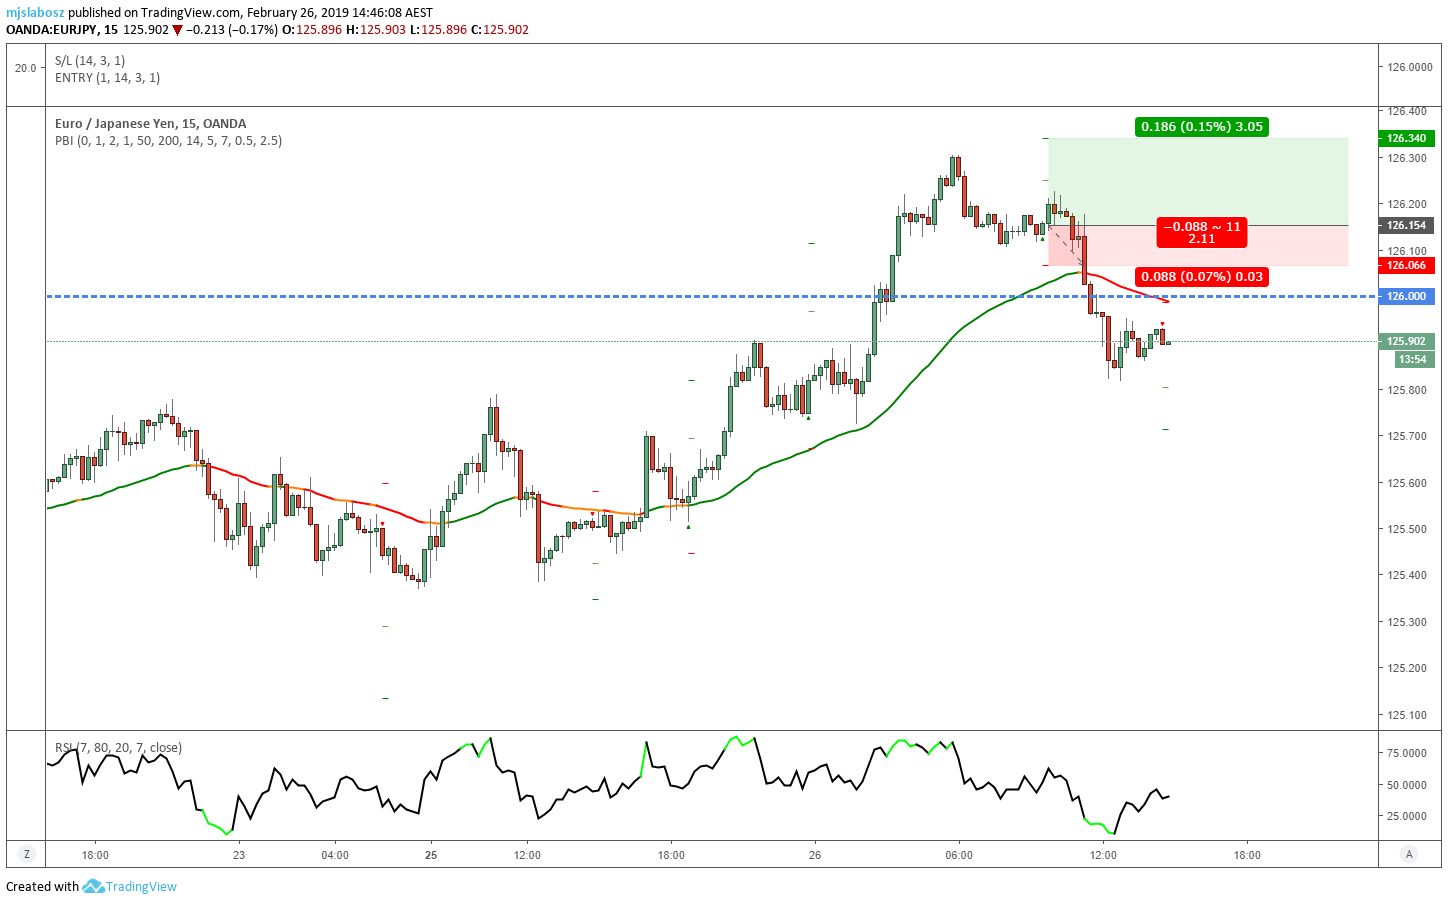
This trade straight up does not meet my rules. I will not go into extreme detail about my trading strategy and trading rules as they are both too boring and too valuable to share for free, but just take my word for it.
That engulfing candle that I entered on needs to either be or immediately follow the lowest swing low of the pullback. You can clearly see that this engulfing pattern occurred as a head-and-shoulder type pattern, and is not a swing low.
I rationalized entering this trade based on the underlying momentum leading up to the setup, but the fact of the matter is this does not meet my rules.
Even if it had won, I would not be proud of it, and I should not be. Therefore, I should not take trades like this. My job as a trader is not to try to outsmart the markets, but execute my edge consistently. It may seem like the same thing in the heat of the moment, but it definitely is not.
They are two completely different concepts (that often conflict with each other). Executing your edge means sticking to your process, not trying to ‘guess’ where the market is headed.
I would do well to remember that.
Trade #17

This was a great trade that fully met my rules. I was extremely tempted to enter this trade early based on those non-swing high engulfing candles leading up to my entry signal, but after losing the previous trade from ‘bending’ my rules, I was determined to be disciplined for the rest of the week.
Note that the indicator I am using on my chart to draw my signals is a custom indicator I created in PineScript. If you are interested in learning how to make your own indicators (or want to try out some of mine), you can see a list of my PineScript coding lessons here (which I am constantly expanding) and a list of my indicators here.
This pullback indicator that I use often paints invalid signals, so I must use discretion to determine which signals are valid and which are not according to my rules. The whole purpose of using this indicator when it gives me false signals is for reducing my screen-time.
Even though the indicator picks up a lot of false signals, it never misses a valid one. So I know that whenever I get an alert I must go and check my chart to see if it is indeed valid. This helps me to trade the 15m chart with minimal stress and screen-time as my scripts alert me to any trading opportunities when I am not near my computer.
Anyway, patience paid in this case, as I eventually got a 100% valid entry reason that went on to hit my target. With my strategy and my rules I know I have about a 55% chance of winning these setups.
And yet I still find myself giving in to the temptation to ‘wing it’ when I know that doesn’t work for me.
It is a very frustrating element of my trading psychology that I must overcome, and I am working very hard on this one habit. Until I stop breaking my rules and believing ‘I know better’, my main focus and goal is don’t break my fucking rules!
I need to work on trusting the process more and being humble. I plan to implement more self-talk throughout my day so that I become more mindful of what I am thinking and feeling whenever I get the impulse to place a trade that doesn’t quite meet my rules.
I have a goal tracker in my spreadsheet that I will use to accomplish this. I am not just going to wishful think my way there, as we all know the road to hell is paved with good intentions. It’s good actions that get you to the glory land.
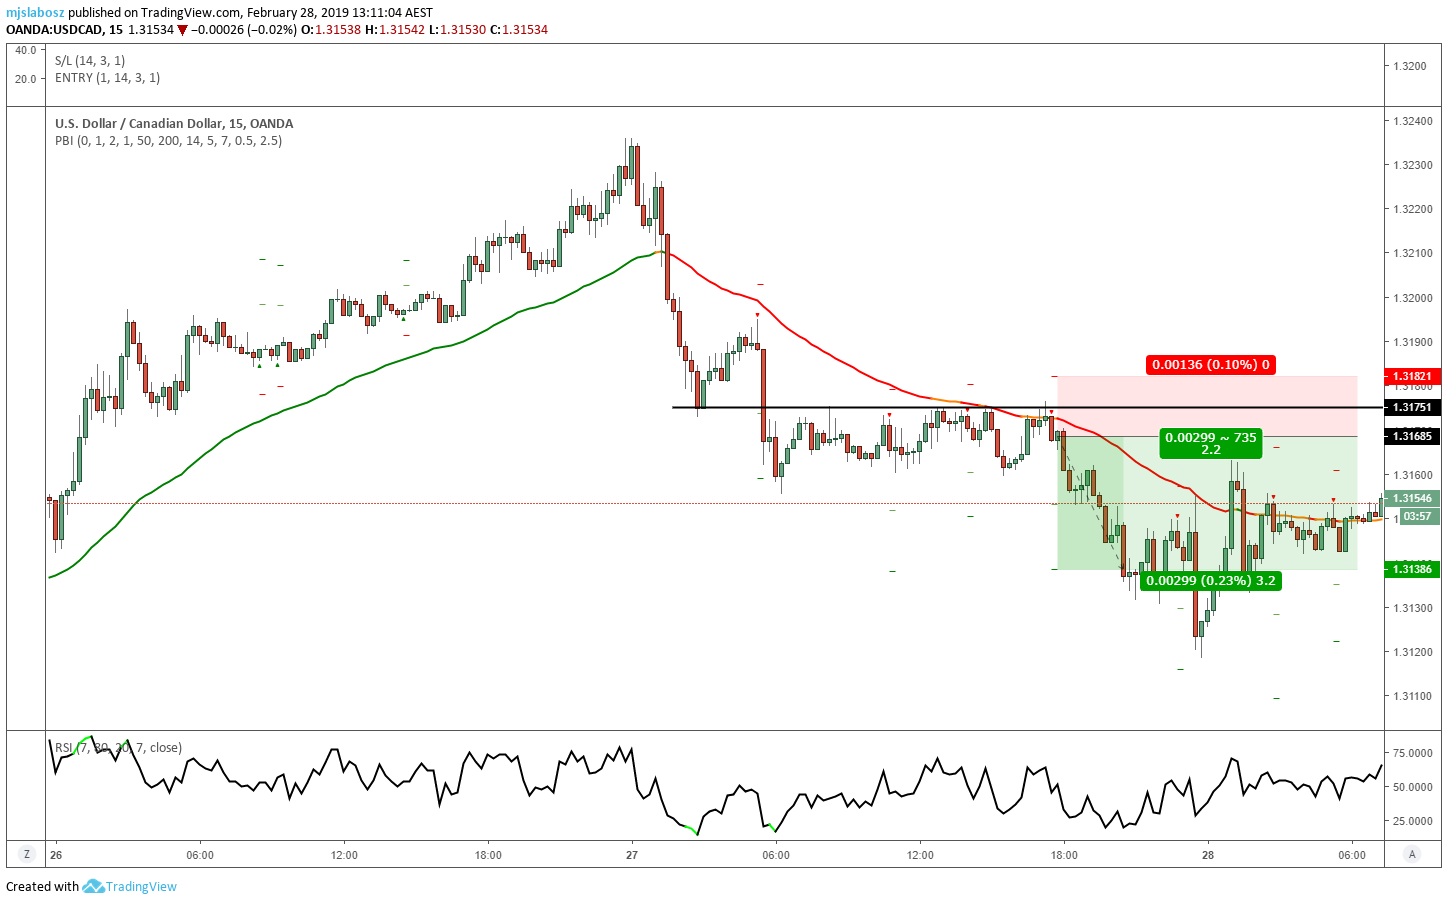
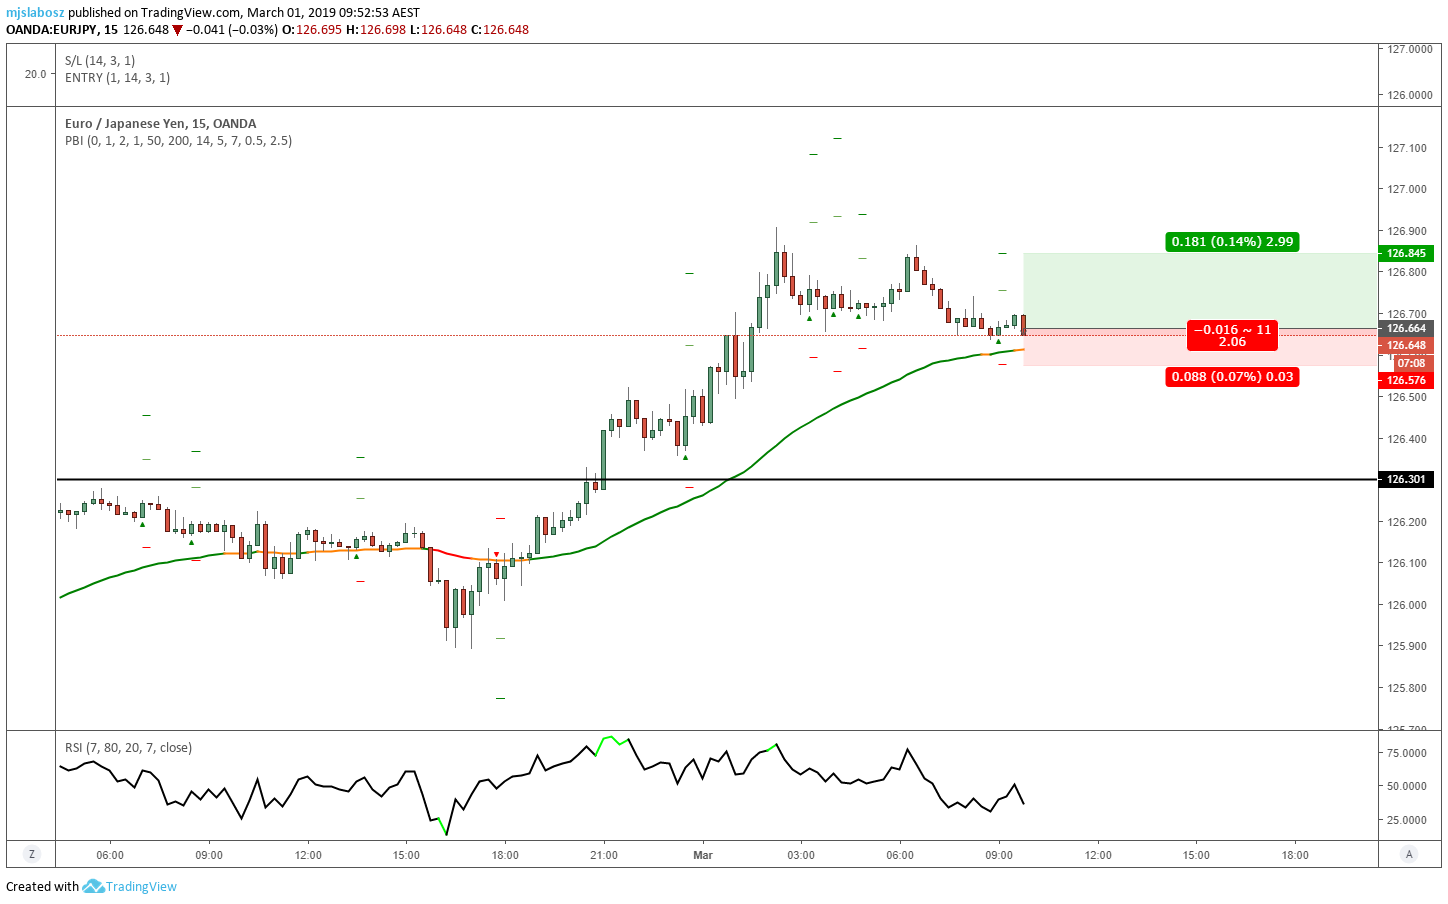
Trade #18
This a good but perhaps mediocre trade that simply didn’t pan out.
It is mediocre because of the clear capitulation that occurred on the bear side before the pullback. In hindsight, it is pretty clear that this is a bullish trend and that the selling that happened before my short signal indicated that perhaps all the sellers left to sell had already panic-sold and the bulls were ready to retake control. The wicks to the downside were a clue.
However, typically these kinds of price action patterns lead to a winning trade. I have found in my testing that when price struggles at a resistance level, then breaks below what should have been the higher-low in a trend-continuation move upwards, then there is a very good chance price will head lower (at least in the short-term).
It is a classic reversal pattern, and when it lines up with an engulfing candle testing the 50-EMA it can be extremely powerful. No dice this time however. This is why risk management is key.
I win more setups like this than I lose, but I still treat every one with skepticism because often times that break of the previous higher-low is just a liquidity hunt for stop orders to push the market higher. That is what those wicks were telling me, but I took the trade anyway because it met my rules, and so it is a good trade; albeit one to study and learn from.
Perhaps down the line if I recognize that setups like this statistically fail more often when there are large rejection wicks testing the previous resistance zone in a trend, then I should pass on them. But for now I must chalk this up as a good trade that met my rules but didn’t pan out, and move on.
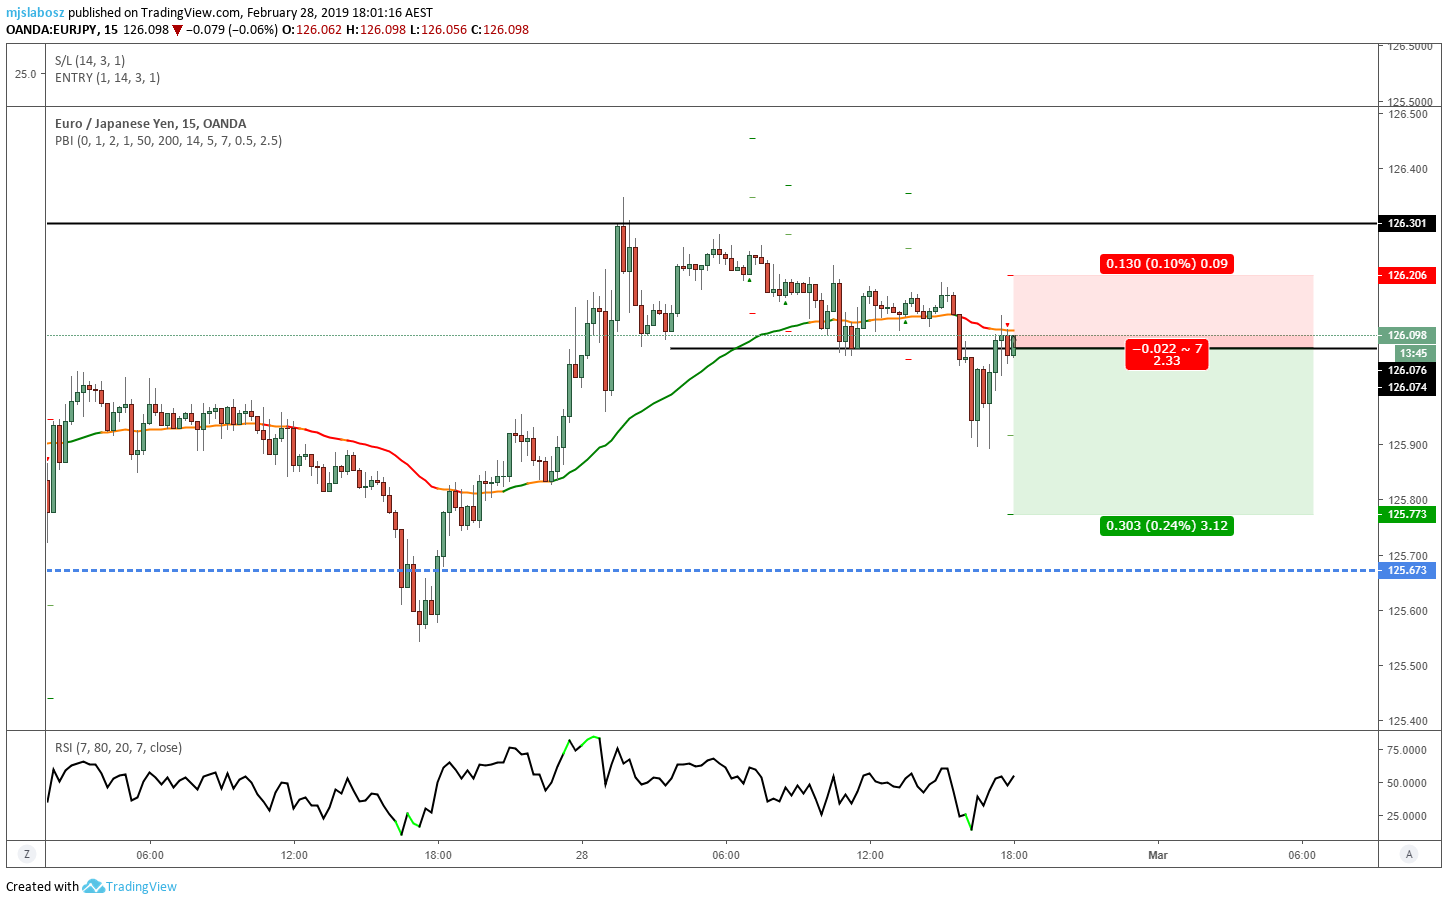
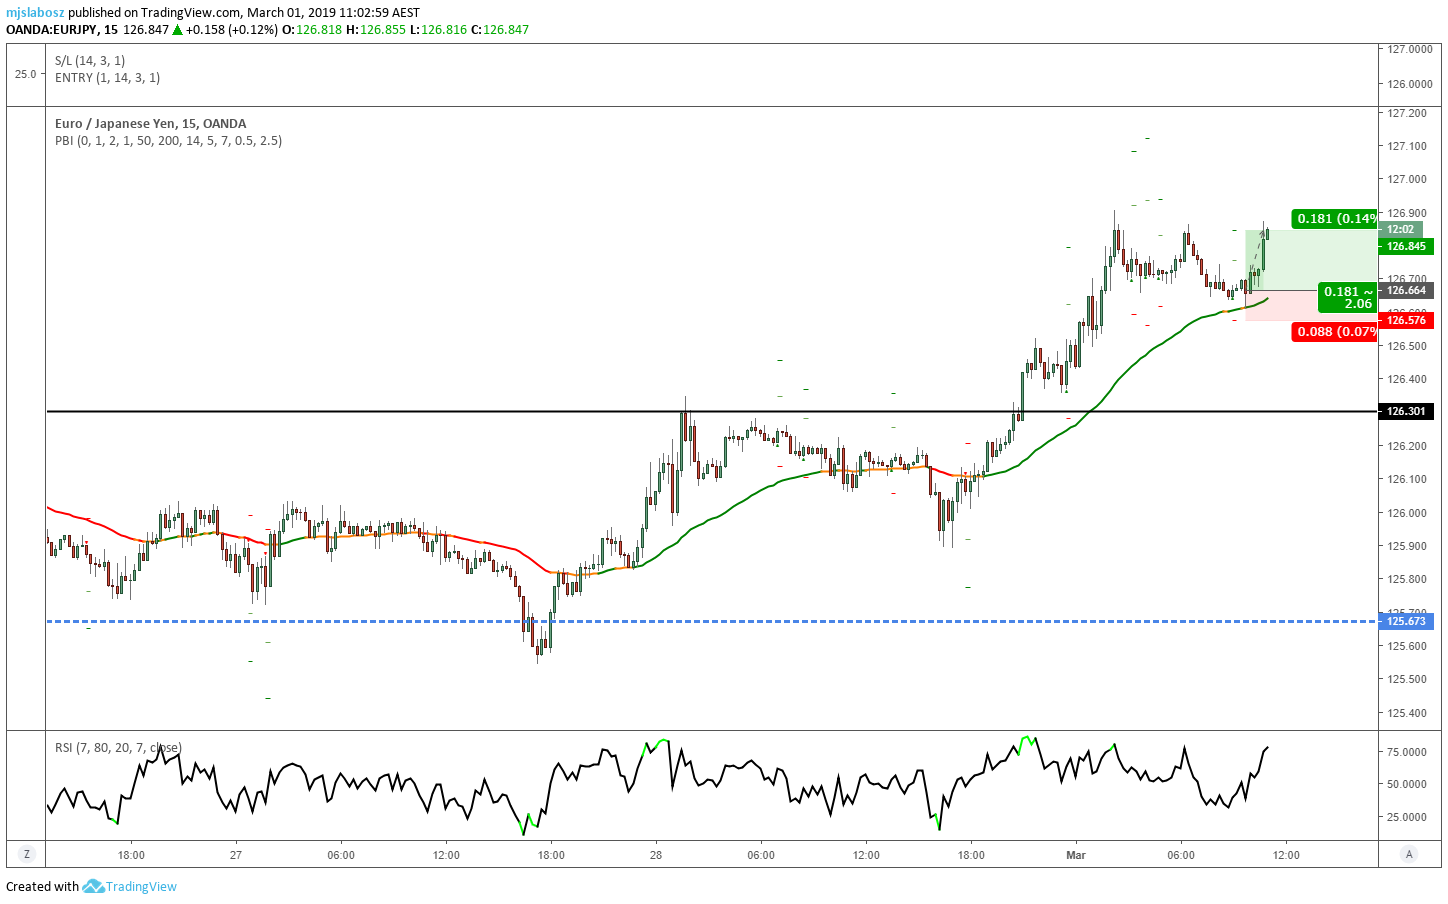
Trade #19


This was another good trade that met my rules. Strong momentum above the 50-EMA, broke and closed above a previous key resistance level (barely) before pulling back to the 50-EMA and giving me a great rejection engulfing candle entry.
Good trade. I would call this a B+ or A grade trade according to my testing and rules. I need to be patient and take more of these, and less sub-optimal setups.
I was not surprised to see price run above the highs and then roll over. This is the beauty of day-trading for me. Even though I had a strong feeling this was headed lower on the higher-timeframes, I also knew there was a high chance of a cheeky intraday stop-loss run above those previous highs.
The build-up of consolidation at that resistance level (which should have had a larger downward effect on price than it did given past context) was the clue.
When price got rejected from that key resistance zone, it should not have found support at the 15-minute 50-EMA and previous minor resistance if it was going to roll over as easily as last time.
Trade #20
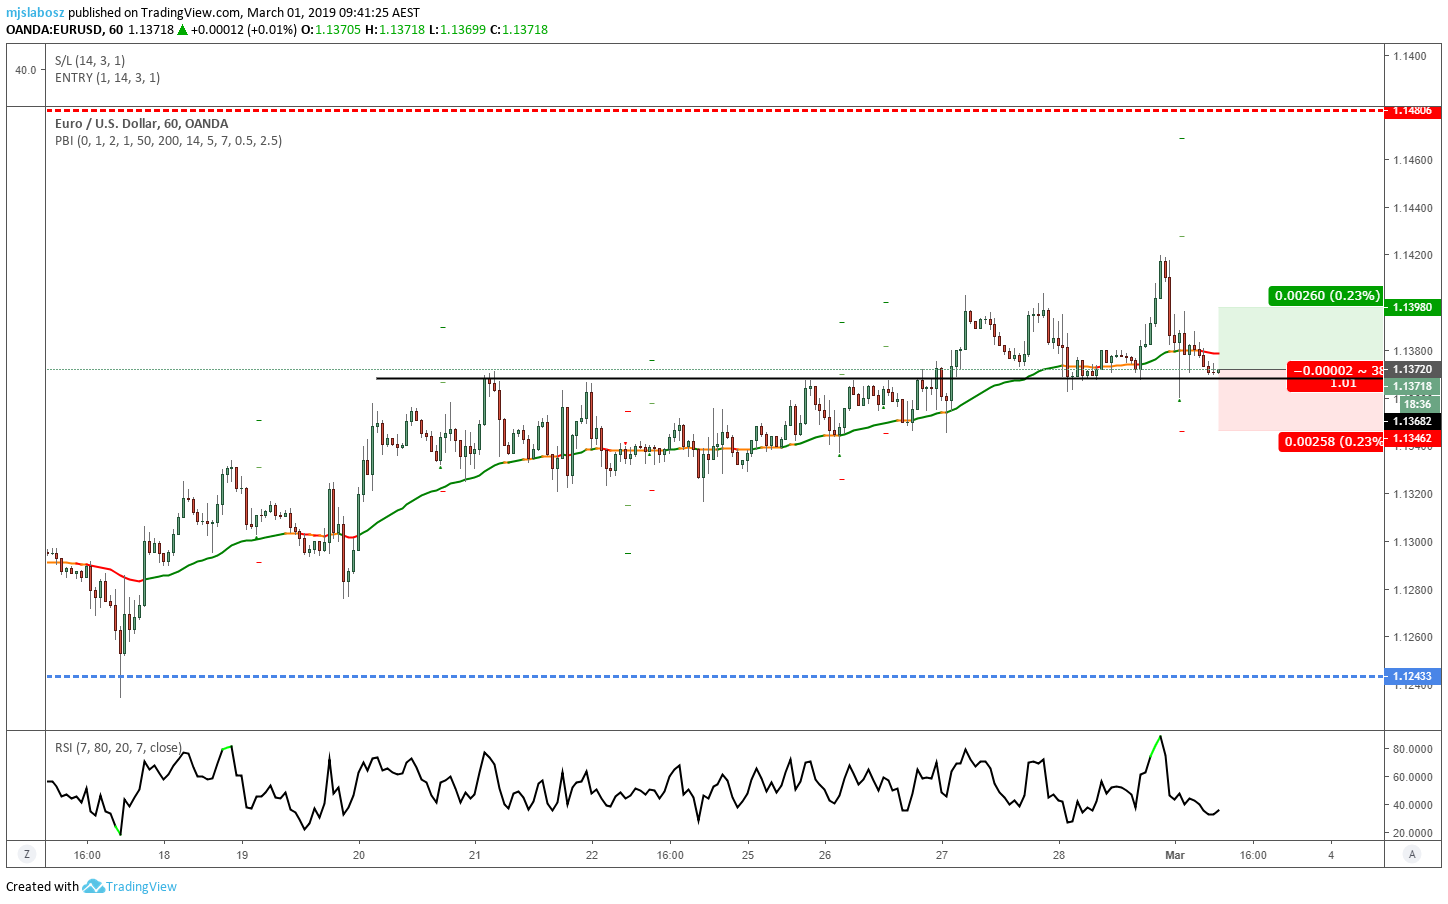
Yet another good trade that met my rules. Price rallied hard and broke above the previous resistance zone, then pulled back and gave a huge rejection candle at the 50-EMA.
For 1-Hour setups I approach trades slightly differently to 15M charts. On 15M charts I take a 1-in 1-out approach, with a single position and a 2:1 minimum Risk:Reward.
On the 1-Hour chart, I take two positions. My first position has a profit target at 1:1, and my second position is a trailing stop position. I trail the stop loss beneath new swing lows if and when a market begins to trend.
This particular candle was far too large for me to enter on as I knew that it was unlikely that price would break above the most recent high to hit my 1:1RR given the rapid reversal that happened after the break occurred.
But I was still looking for a potential 1-target pop out of this market, and I got it. By waiting for a better entry, I managed to get a 1:1RR on my position that fell within the consolidation range. I knew that with my target there, I had a much better chance of winning the trade.
Sure enough, EUR/USD did pop off previous resistance one last time and I got my 1-target winner. My second position was stopped out for break-even, making this a 0.5% gain, but a gain nonetheless.
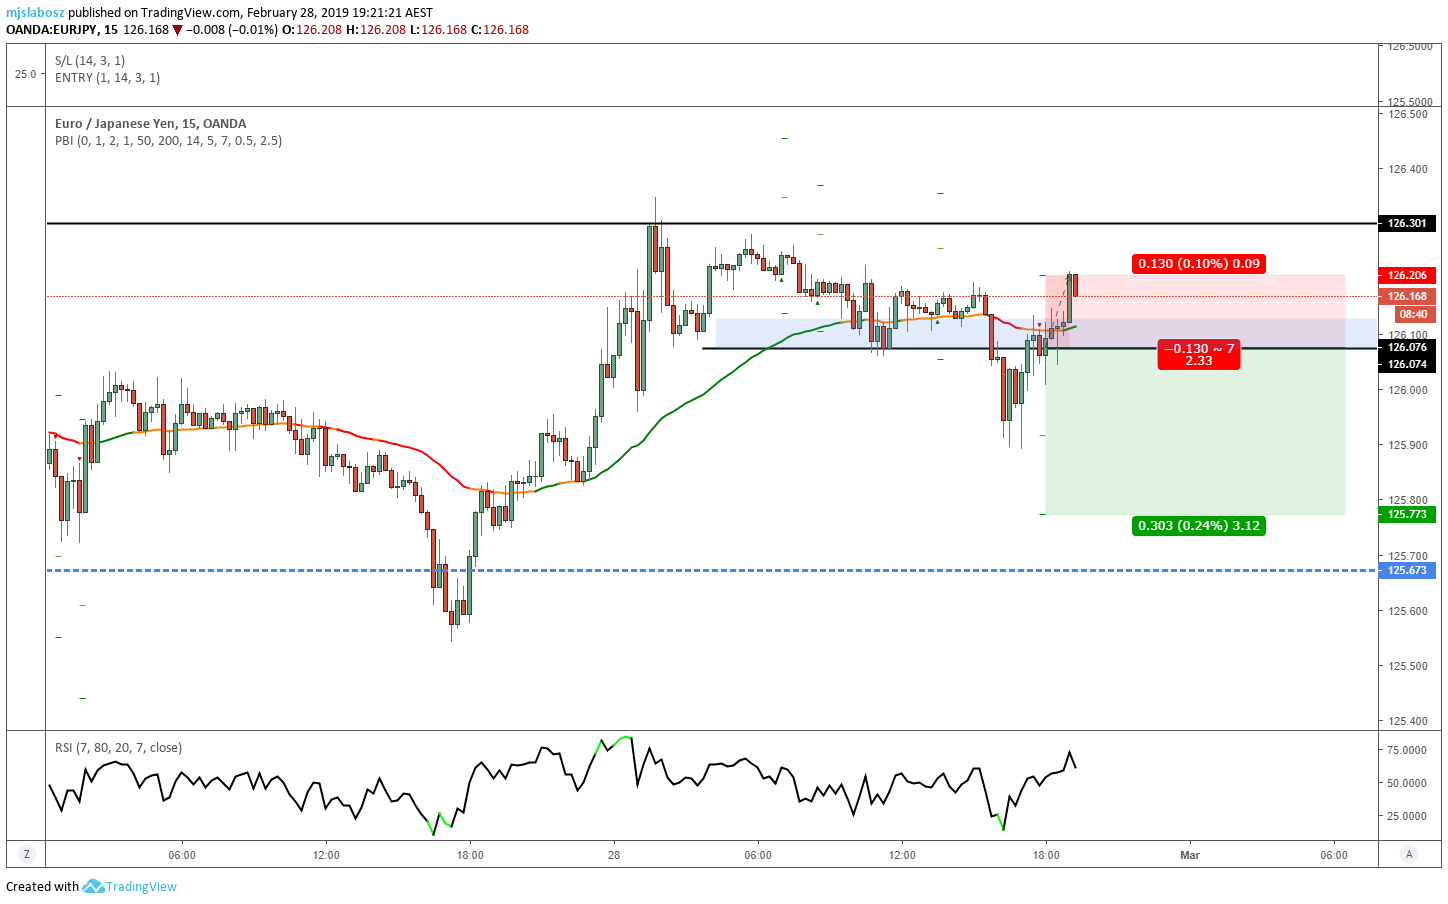
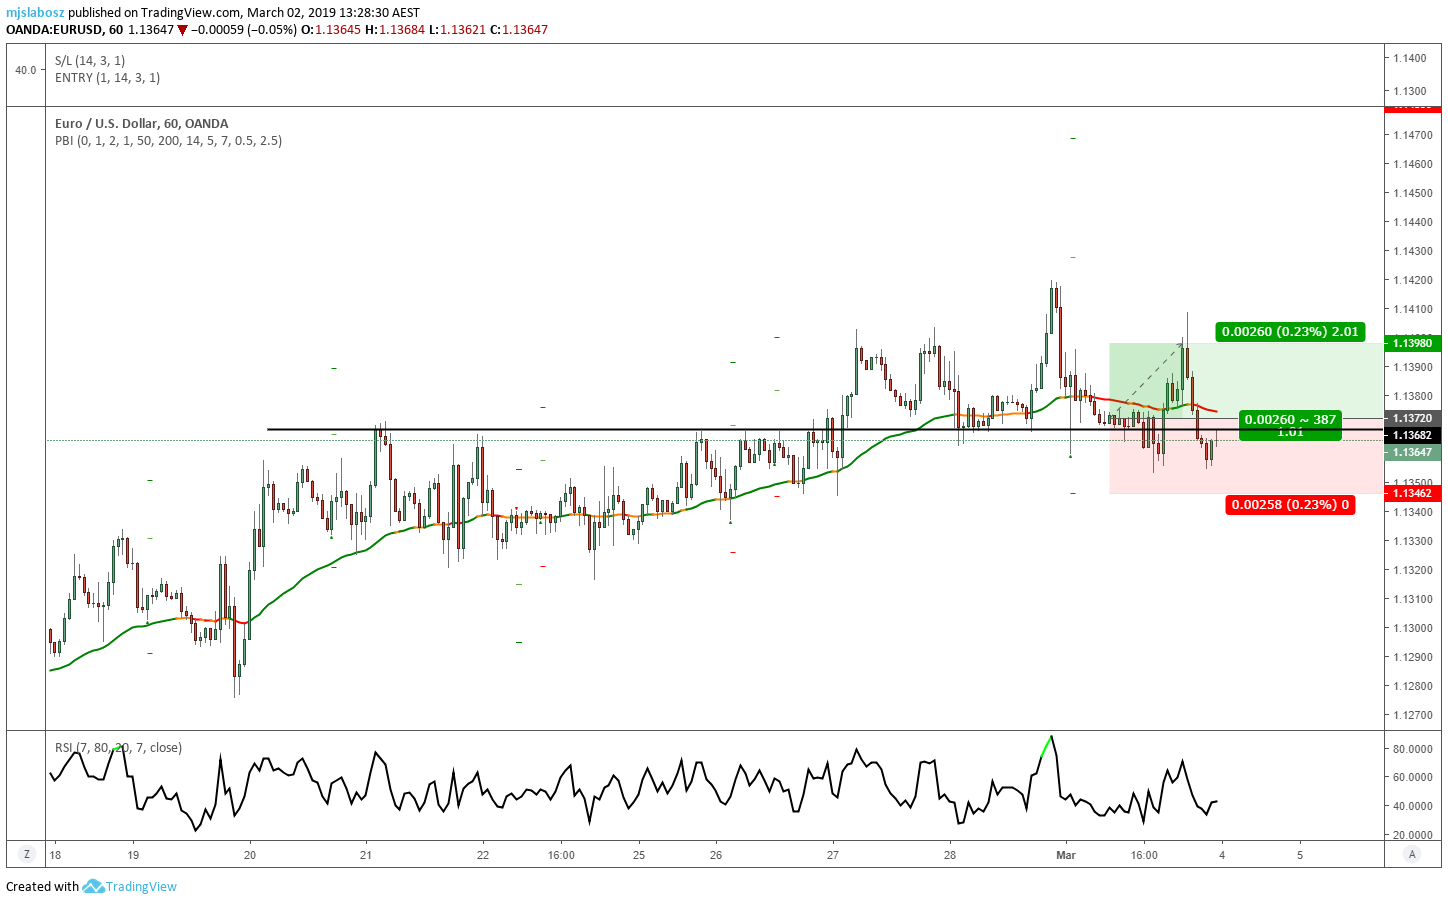
Trade #21
After starting the week off with a bad trade that broke my rules, I really ended the week strong. Yet another winning trade here that met my rules 100%.
I did not like the double-top before my entry signal, but on the higher-timeframe there was plenty of room to move higher. The Daily candle from the day before closed as a big strong green candle, so I had a feeling that price was going to pop higher despite looking over-extended.
Price went on to make a new leg higher and I missed out on a heap of profits, but that’s ok. With my day-trading strategy I only ever look for a 2ATR move on 15-minute charts, and I got it, so I was happy.
One last winning trade to add to the list. This trade finally brought me within 0.2% of overcoming my 5% drawdown for February, and several steps closer to overcoming my 9% drawdown for the year.
Trade #22
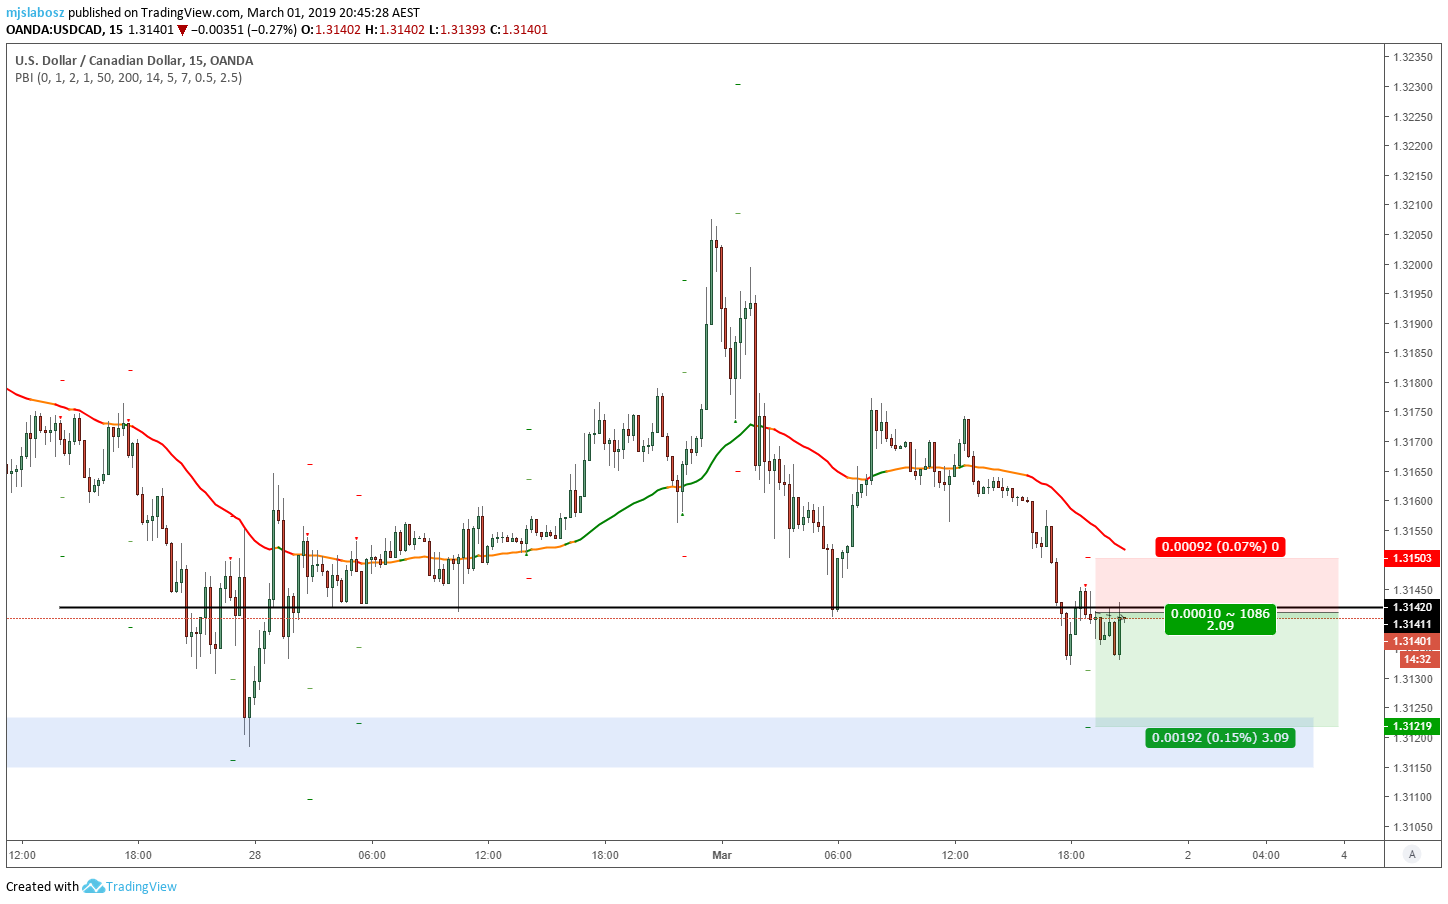
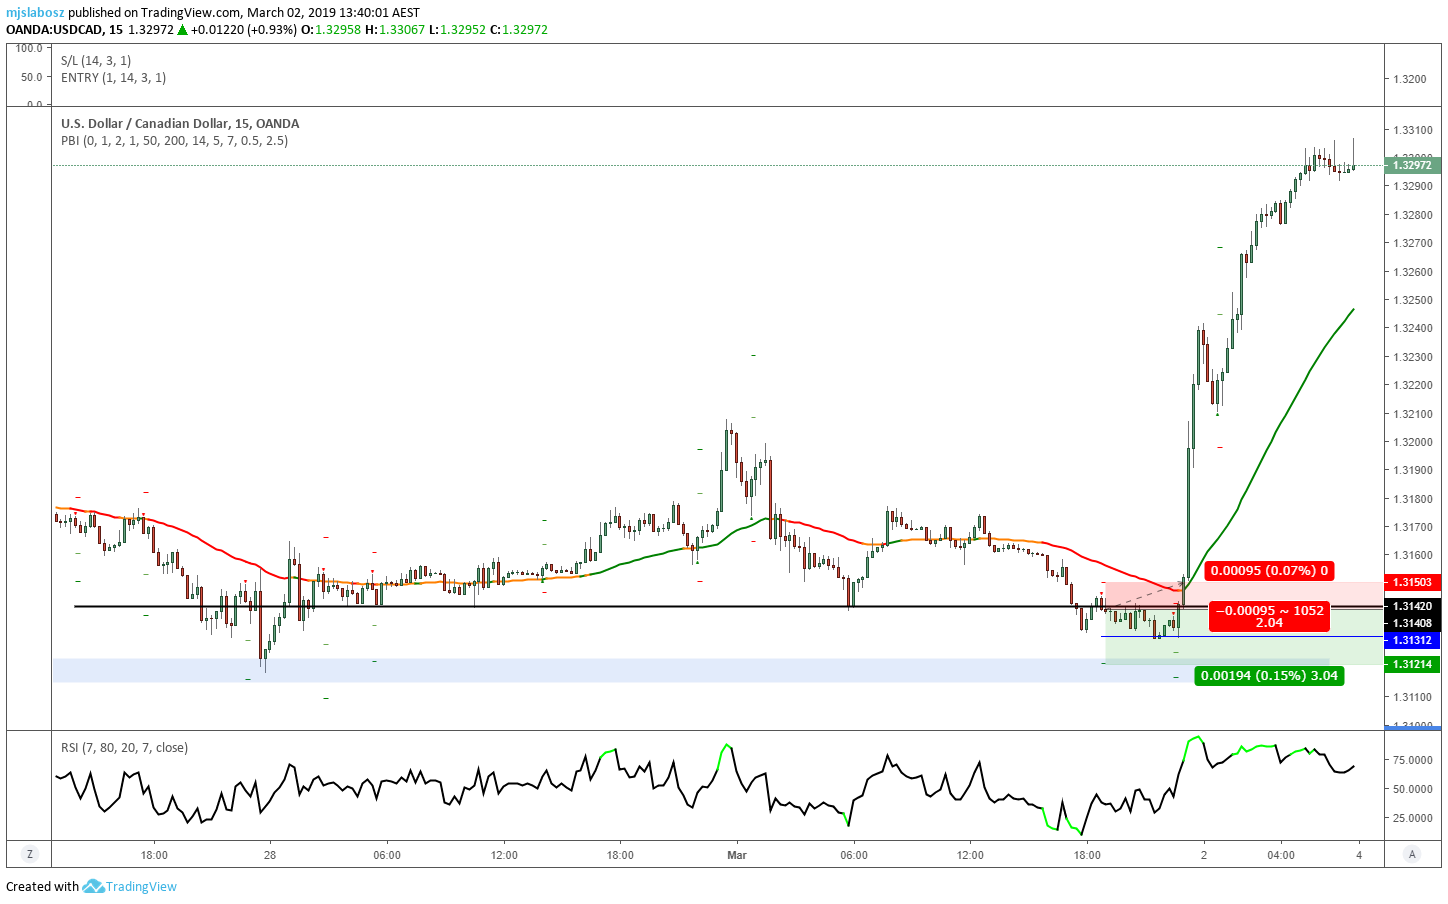
This was a sub-optimal entry, and I knew it. Price was within consolidation, but I thought that because we had broken below a key previous support level we may re-test the lows in the blue zone.
Fortunately, my strategy allows me to roll my stop-loss to break-even on intraday trades after a 1ATR move (hit at the blue line in the screenshot). So right before I went to bed on Friday night, I moved my stop to break-even.
Which was lucky, because had I not used a stop loss, I would have been blown out of the water by that bull rally that occurred overnight.
Thanks to self-discipline and trust in my trading process I came away unscathed with nothing but a small commission to pay – despite being very wrong about this trade.
Reflection
The past few months have been rough for me. I have really let myself down some weeks. But I have turned that around in a big way the past few weeks, and I am determined to continue grinding out profits for the rest of this year.
My goal is not results-based, but process-based. I know that if I can drastically improve my ability to stick to my rules and take only good trades then my results will improve drastically.
Process over outcome, and continuous incremental improvement. That is my new motto.
End of Month Review
At the end of each month I will review my overall stats and performance, starting now.
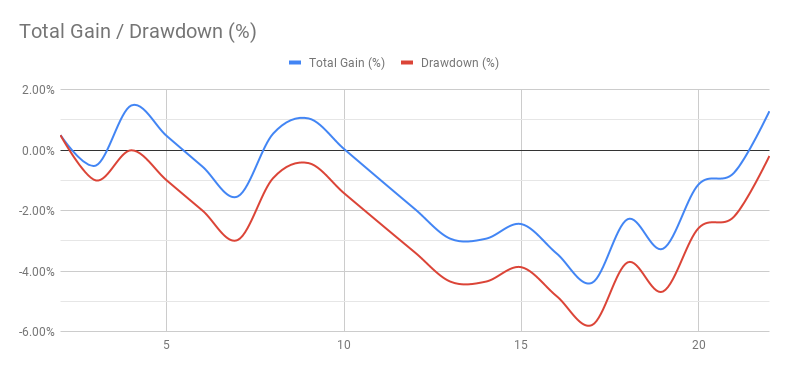
This was my spreadsheet for February (click to enlarge):

These are my goals and performance stats for February (click for more detail):

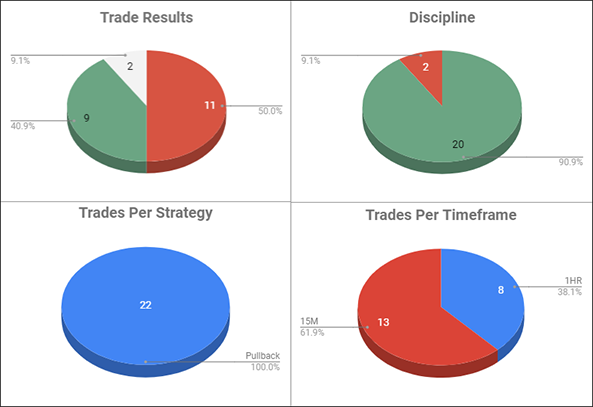

As you can see, I have only been trading my new pullback strategy on a handful of pairs.
I have optimized my portfolio and narrowed my trading down to AUD/JPY, USD/CAD, EUR/USD and EUR/JPY (with a touch of AUD/CAD thrown in when the conditions are right). I only trade the 15M and 1-Hour at this stage, but I am developing and testing a 4-Hour strategy that I plan to implement at some point.
So far my stats are disappointing and not representative of how my strategy should be performing statistically (ie. my results do not match my back-testing performance).
This means that I am not trading the strategy as I designed it and I need to do a lot of work on making sure I am aware of my bad habits and that I am executing consistently. The past few weeks have been a real break-through for me in this area and I hope I can keep it up.
The 9% drawdown doesn’t register on the Myfxbook graph, because before the 9% drawdown I started out with a 6% gain on my first win for the year. So my drawdown for January was 9% from my equity ATH, but only 3.7% from my initial account deposit.
The equity curve screenshot is from my Excel spreadsheet which I overhauled at the beginning of February and began with a fresh slate, so that does not record the 9% drawdown either.
And as Friday was the 1st of March and I finished the week with two winners some of my stats bleed over into March here. I will review my overall stats at the end of March, but hopefully I can grind my way to another positive month.
In the meantime I will try to post my trading journal at the end of every week to keep these statistics up to date and relevant.
Happy trading, and good luck out there!
Next Week’s Goal:
Don’t break my trading rules
This Week’s Review
Myfxbook Stats

