May 2019 Review
Table of Contents
Forex Trading Review – Week 22
This month was a big leap forward for my trading and my equity curve. I beat my all-time record of +15.61% by +0.21%. As I’m a big fan of Kaizen and incremental improvements, that’s a huge win for me.
I learned a lot about my strategy, I’ve improved it significantly this year, and I feel my results are beginning to reflect my efforts in that regard.
I’m anticipating a drawdown soon as that’s just how things are over the long-term. You can’t win trades forever. There will come a time when I go back to struggling to make money, but that’s ok.
So long as I manage my risk and don’t give back too much of my profit over the rest of the year then I ought to finish the year with a positive return which is always my number one goal.
Anything beyond that is a bonus!
27th May – 31st May
Trade #90
| Market | EUR/JPY |
| Date & Time | 28/5/19 4:15 PM |
| Daily Trend | Bearish |
| Timeframe | 15M |
| Strategy | Pullback X |
| Result | +1.32% |
| Verdict | Good Trade |
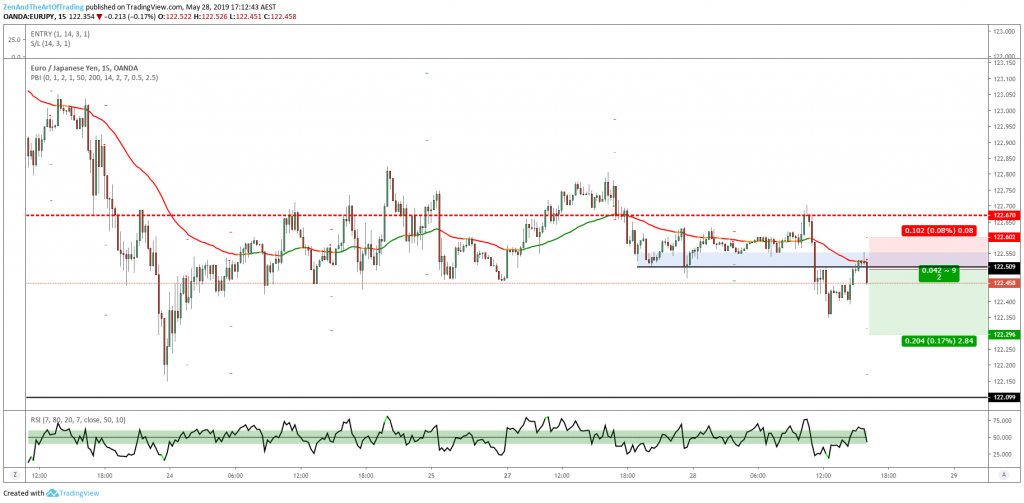
Trade #90 – Before 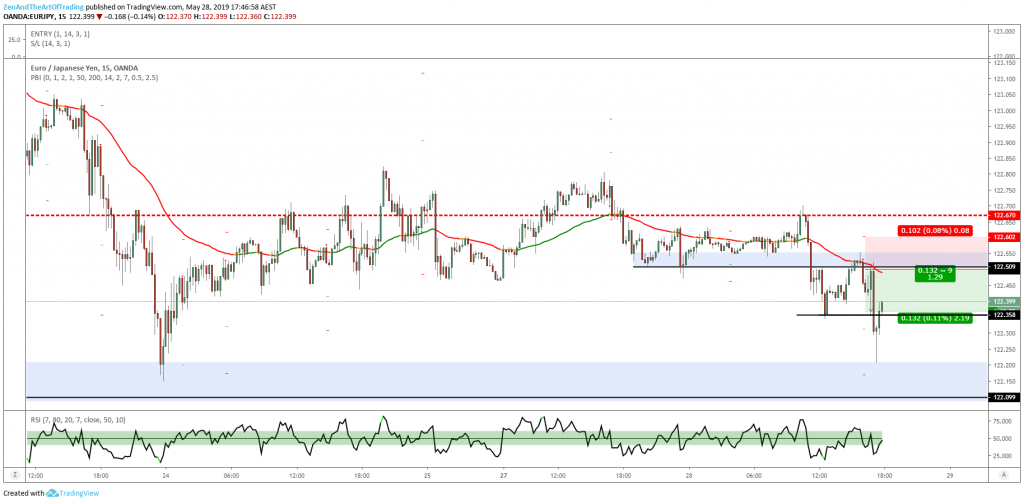
Trade #90 – After
Reflection:
I’ve turned my weekly habit of starting out with a bad trade around it seems. Not trading on Mondays has definitely improved my results and trained me to become more selective with my trades.
I got this pullback opportunity on Tuesday. Price broke and held below a key Daily support level and then I got a 1-2-3 reversal move on this timeframe. Then price retraced back into previous support and gave me an entry signal, and I jumped on it.
Great trade to start the week. Exited after a higher-high higher-close candle as per my new strategy’s rules.
Unfortunately I did not get as much profit out of this as I’d hoped because of the reaction from the support zone in blue, but that’s ok – price retraced past my stop loss after the bounce so I’m glad my strategy got me out when it did.
Trade #91
| Market | EUR/USD |
| Date & Time | 29/5/19 12:00 PM |
| Daily Trend | Bearish |
| Timeframe | 1HR |
| Strategy | Pullback |
| Result | +1.63% |
| Verdict | Good Trade |
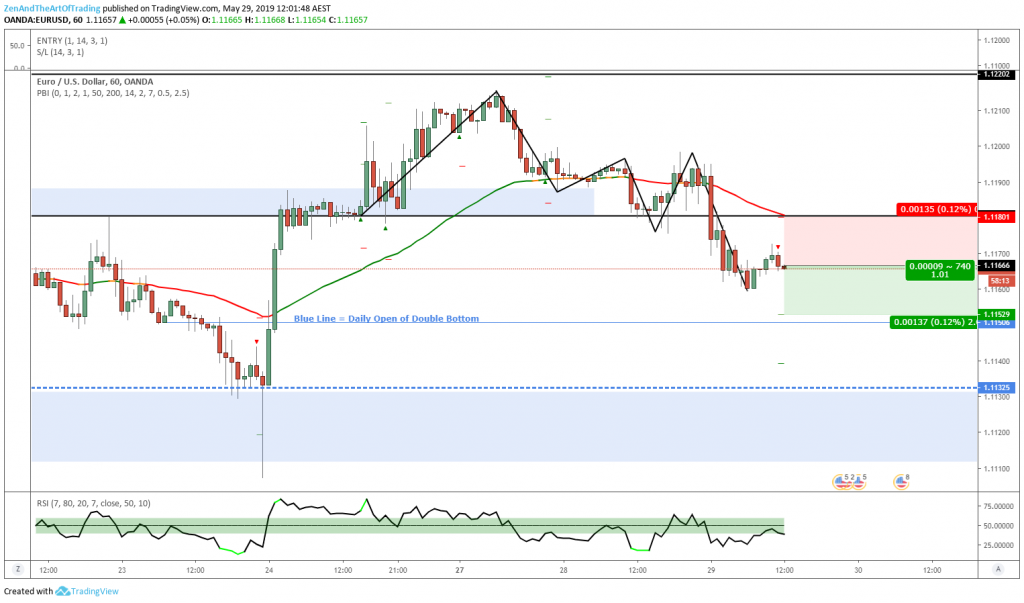
Trade #91 – Before 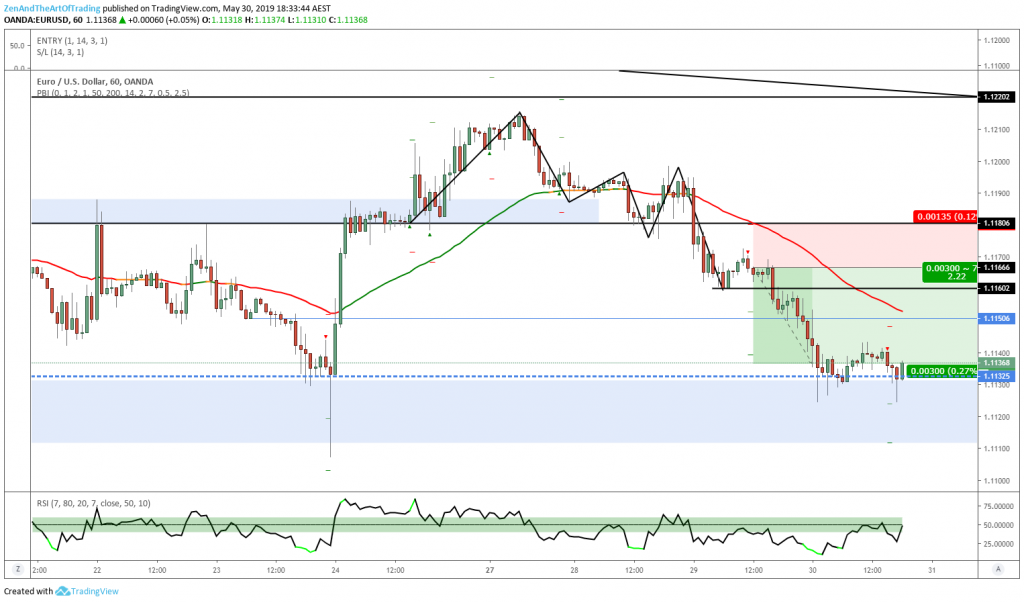
Trade #91 – After
Reflection:
This setup on EUR/USD was a great trend-continuation play on this timeframe.
The Daily chart is in a bearish trend and price failed to hold above the resistance-turned-support zone from last week (upper blue zone). It had also begun printing lower highs and lower lows, so with plenty of room back down to the lows of the recent bearish Daily range, this was a great pullback entry.
When price got down to that major support zone we got a double-bottom with several higher-high higher-close candles in the zone, so I decided to exit my second target for a 2.2R profit. I was hoping for more, but given the significance of that support zone, I figured I should play it safe and lock in the profits.
But if we get a break and close below that zone I’ll be stalking a potential re-entry for sure.
Trade #92
| Market | USD/CAD |
| Date & Time | 30/5/19 9:15 AM |
| Daily Trend | Bullish |
| Timeframe | 1HR |
| Strategy | Pullback |
| Result | -1.02% |
| Verdict | Good Trade |
Trade #92 – Before 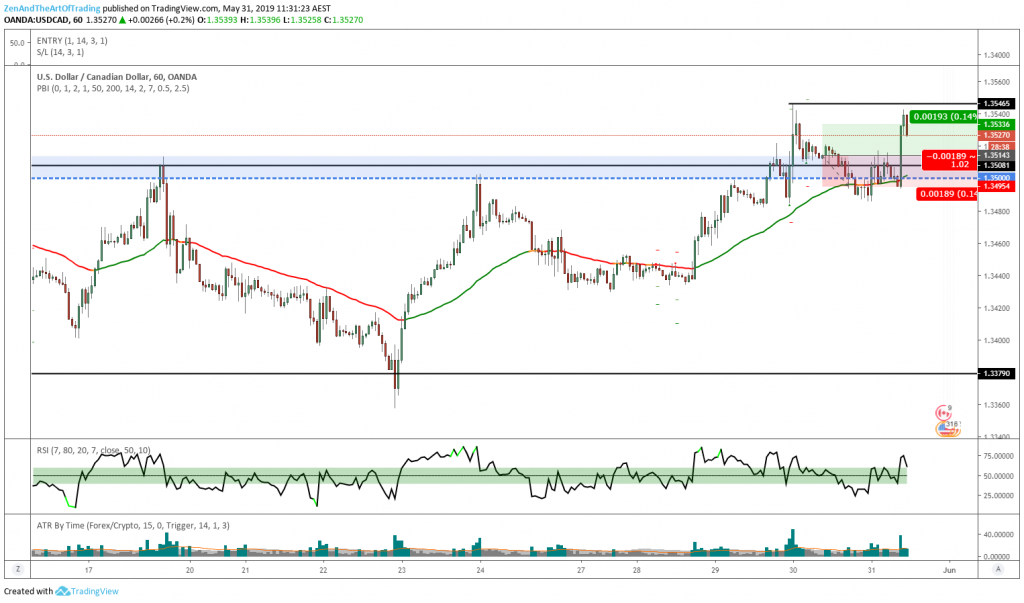
Trade #92 – After
Reflection:
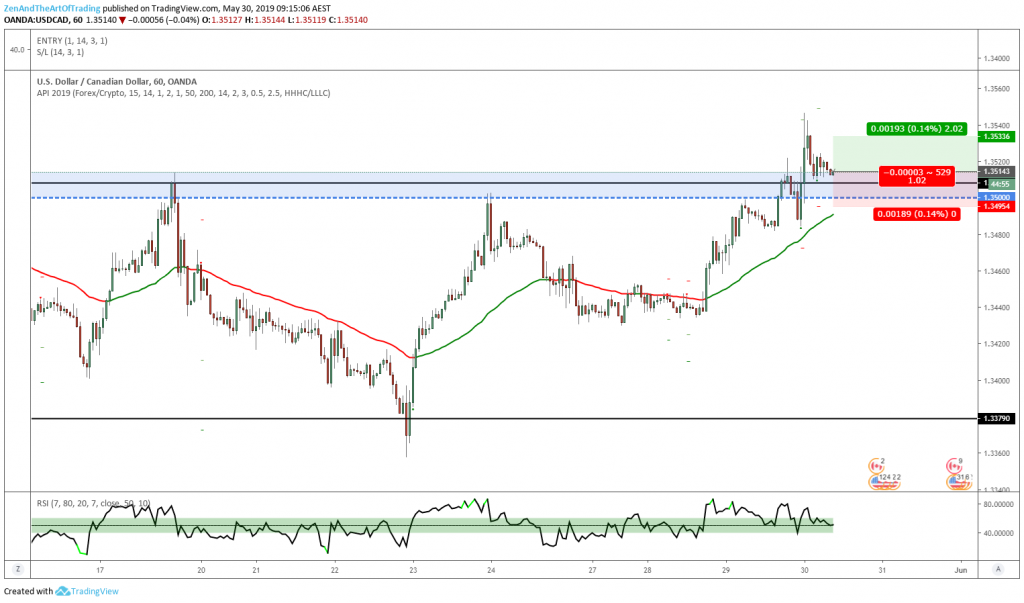
This was disappointing. USD/CAD finally broke out of the Daily range like I’d been anticipating since the start of last week. I got a perfect pullback entry into the highs of the zone and the 1.35 even handle.
But price decided to retrace a little deeper and stop me out right before continuing the breakout. Ah well, you can’t win them all. This was a great trade that I’d take 100 times out of 100 so I can’t feel too bad about it. It happens.
Trade #93
| Market | EUR/JPY |
| Date & Time | 31/5/19 9:30 AM |
| Daily Trend | Bearish |
| Timeframe | 15M |
| Strategy | Pullback X |
| Result | +2.31% |
| Verdict | Good Trade |
Trade #93 – Before 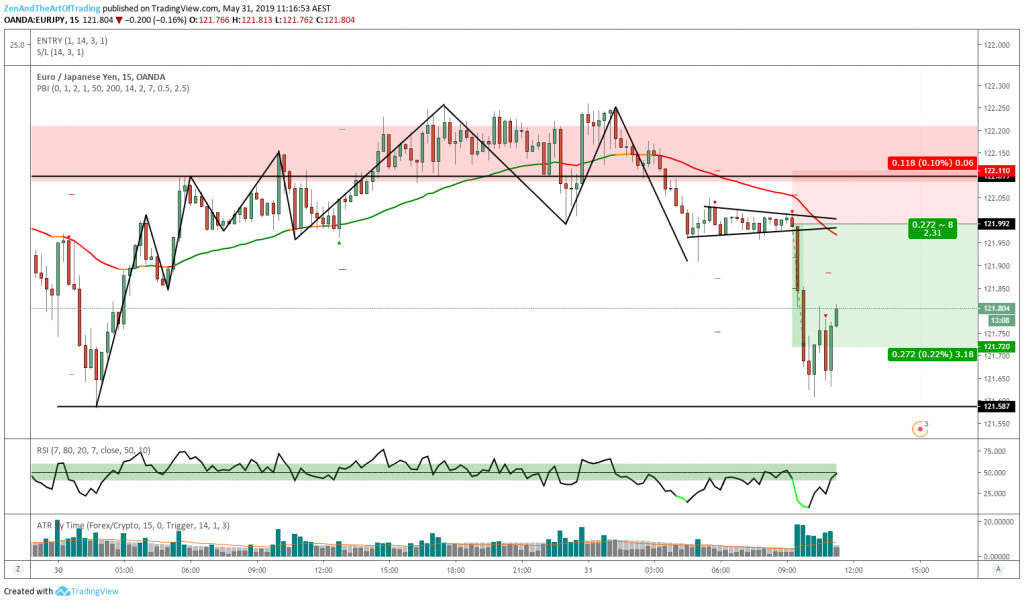
Trade #93 – After
Reflection:
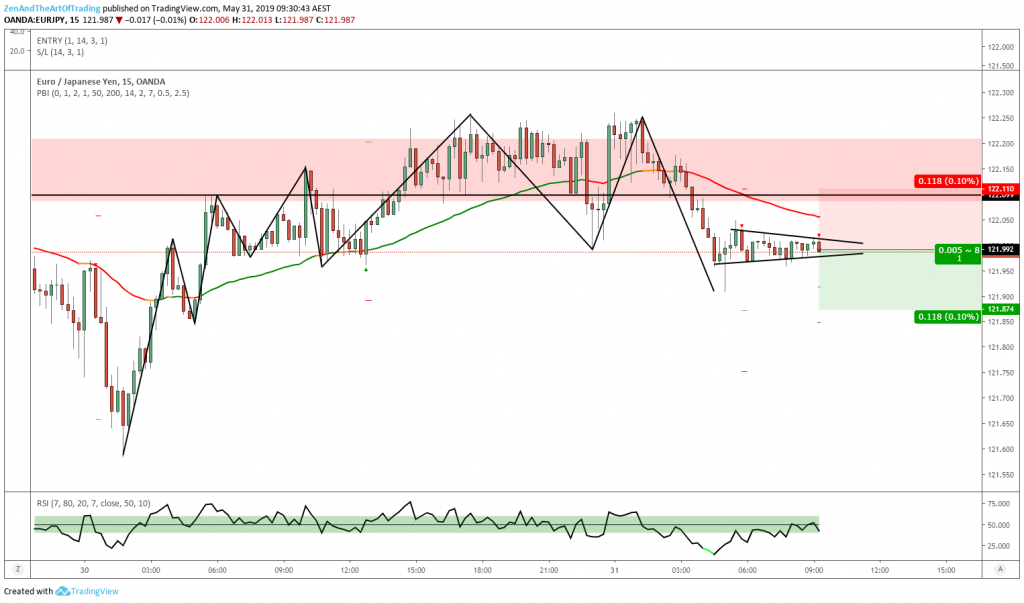
My second-last trade for the week. When I began my top-down analysis for the day on Friday I noticed this move on EUR/JPY.
We had just failed to break and close past the red zone which marked previous support in trend on the 1HR and 4HR timeframes.
So when I noticed this, and saw that the 15M chart had put in a 1-2-3 move to the downside out of that zone and had begun forming a bearish flag pattern coinciding with my pullback engulfing candle setup, I decided to get involved.
Literally minutes after I entered my position the market tanked lower. I got very lucky with timing on this trade. When the RSI went heavily oversold and price put in a bullish engulfing candle at the previous 1-Hour support, I exited the trade for 2.3R profit as per my rules.
Unfortunately price rolled over after that and went much lower, but I followed my rules on this trade so I can’t let that bother me too much. I can only trade what I see at the time.
The time for optimizing exits is not during trades, but during testing and strategy reflection, which I try to do quarterly and bi-annually.
Trade #94
| Market | USD/CAD |
| Date & Time | 31/5/19 9:45 PM |
| Daily Trend | Bearish |
| Timeframe | 15M |
| Strategy | Pullback |
| Result | -1.01% |
| Verdict | Good Trade |

Trade #94 – Before 
Trade #94 – After
Reflection:
My final trade for the week was a losing trade on USD/CAD 15M.
After we finally had a breakout on the Daily I was prepared to take any valid long opportunity that I got. This pattern is a valid pattern, and although price was looking a little over-extended and I had a feeling it was going to lose, I took it anyway because it met my rules 100%.
So this was a good trade. Unfortunate to end the week and month on a loser but we don’t have any control over that as traders. I’m happy just to end the month with a double-digit % gain and minimal trading errors.
Weekly Reflection
Last Week’s Goal: Execute my plan flawlessly. Don’t over-trade.
Overall Grade: A
Another great week, a huge month. If I keep this up then I am confident I will end the year profitably and maybe even exceed my goal of a 30% return.
The markets have been extremely cooperative with my strategy lately, so I can’t take too much credit for my results. Eventually that will change and I am ready for my hot streak to end whenever it does.
But I am excited that my strategy is performing much closer to my backtesting results now. I am definitely becoming a lot more disciplined and self-aware as a trader, and I have no doubt that this weekly journal is helping with that a lot.
We’ll see what the rest of the year brings, but so far so good!
Monthly Review
Here is my equity curve after the month of May:
Monthly Return: +15.82% | Annual Return: +22.70%
Here are my monthly stats for May:

And here is my drawdown graph for the year:
This month all of the pairs performed profitably except for AUD/JPY. Last month AUD/JPY was the best-performing pair, so this exemplifies the purpose (and importance) of diversifying the correlation between your portfolio pairs.
The reason I trade only these 4 pairs is because I have hand-crafted my trading plan and my trading strategies to optimize my gain while minimizing my theoretical worst drawdown.
These pairs are the least correlated profitable pairs I could find, and although there are some other combinations that are perhaps more profitable, they also come with more risk.
So far this year I am comfortable with my strategies performance. My Myfxbook stats say that my max drawdown was -12% (that giant spike on the graph), but this is a bug in my broker stats that I explained in a previous journal entry.
I’m not sure how to delete that incorrect data from my records or if I even can. Akil Stokes mentioned on a podcast episode that people can manipulate their Myfxbook stats but if that’s true then I haven’t worked out how to do it (and I don’t plan to).
In any case, my real max drawdown for the year is -8%, which is a lot closer to the average drawdown I expect out of my strategy according to my backtesting.
Discipline Review
I only blatantly broke my trading rules once this month, which is bad, but a massive improvement on previous months. I did not make any trading errors, so that’s also a great improvement.
The trade in question was Trade #82:

Trade #82 – Before 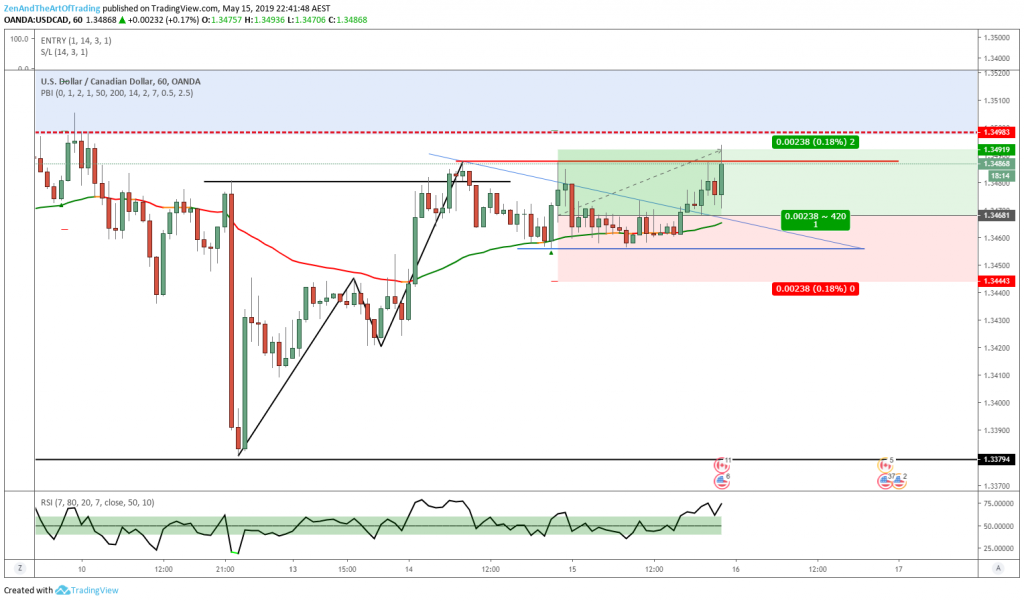
Trade #82 – After
I closed this trade out for close to break-even after an important economic data release. I made an impulsive decision to close the trade after I realized the data was causing a bearish reaction on USD/CAD.
Of course, immediately after exiting the trade, price reversed and went on to hit my would-be target, costing myself a winning trade.
In response to this I decided to no longer allow myself to make trading decisions using my mobile phone, and when economic data releases I am no longer allowed to watch the reaction.
My rules don’t allow me to make decisions like that because I never accounted for news in my backtesting, and by closing trades around news prematurely without a good reason just because I ‘feel’ like it, I jeopardize my edge.
So I nipped that one in the bud early and hopefully I can turn one bad trade into zero bad trades next month.
In any case, here is my trading discipline stats for 2019 so far:

Conclusion
So yeah… that’s it for this month’s review. Things are going well, and I don’t plan on changing anything about my approach any time soon. So I guess you’ll be seeing more of the same out of me for the next few months. And hopefully that leads to a modest gain by the end of the year, but we’ll see.
All I can do is control what I can control, which in this case is my process. So I will continue to focus on process over outcome, I will keep incrementally improving every aspect of my trading that I possibly can, and I’ll be patient and wait to see how my performance develops.
Until next time…. trade your plan, plan your trade, be well, and speak soon.
Next Week’s Goal
Execute my plan flawlessly. Don’t over-trade.
Previous Week’s Review
This Week’s Review
Myfxbook Stats

